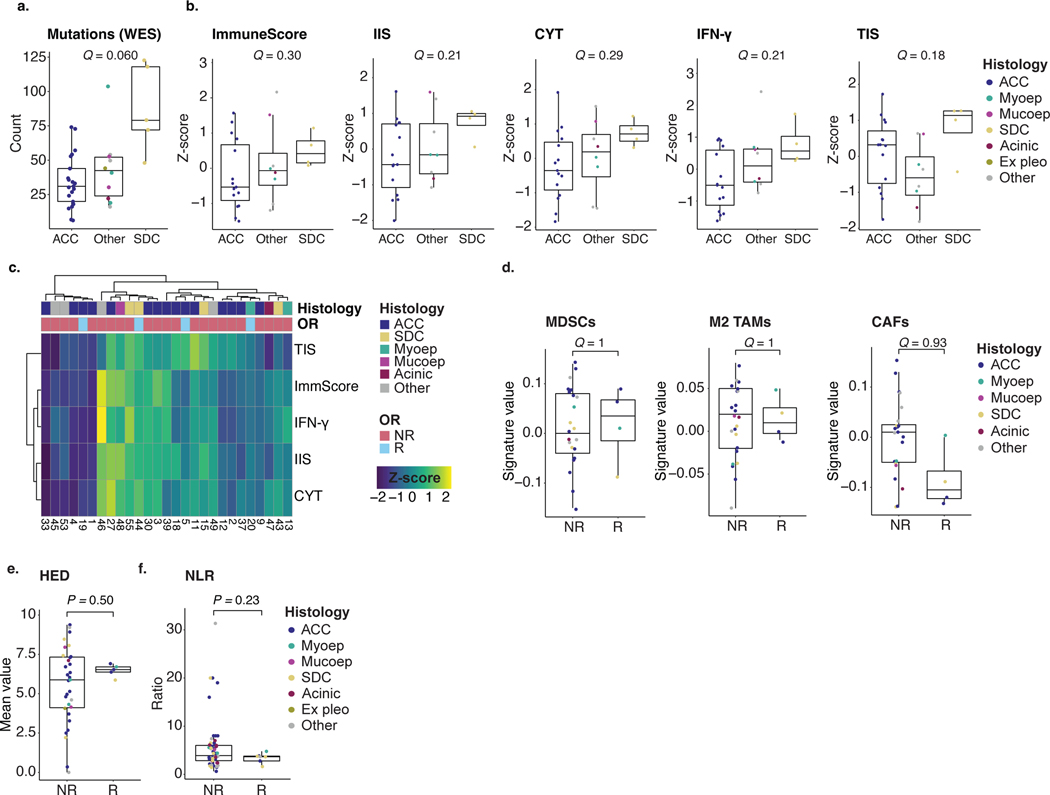
Extended Data Fig. 2 |. Pre-treatment immunogenomic features of ACCs and non-ACC SGCs in the context of treatment (non-)response.
Box plots defined in Methods. Individual dot colors in a, b, d–f indicate SGC histology. A Kruskal-Wallis (a, b) or two-sided Wilcoxon rank-sum test (d–f) was used to calculate exact P-values. P-values in a, b, d were adjusted for multiplicity (Methods), yielding q-values. a. Non-synonymous mutation count per exome in ACC (n = 21), SDC (n = 5), and SGCs of other histologies (n = 10). b. Z-scores for the ESTIMATE T cell and immune infiltration score (TIS and IIS), ImmuneScore, Reactome interferon gamma (IFN-γ), and cytolytic activity (CYT) RNA signatures in ACC (n = 15), SDC (n = 4), and SGCs of other histologies (n = 8). c. Heatmap of the signatures shown in b. Top tracks represent sample histology and objective response of n = 27 samples. d. Values for the MDSC, M2 TAM, and CAF RNA signatures in NR (n = 23) and R tumor samples (n = 4). e. Mean evolutionary divergence of germline HLA (HED), obtained from healthy control WES data, in NR (n = 31) and R patients (n = 5). f. Peripheral blood neutrophil-to-lymphocyte ratio (NLR) in NR (n = 56) and R patients (n = 8).

