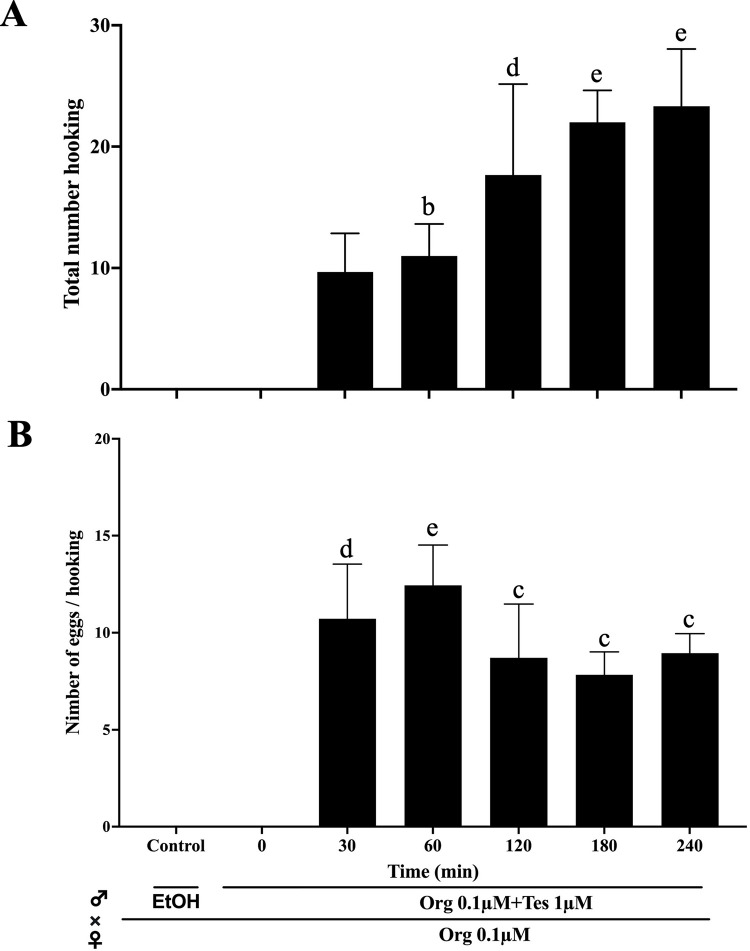
Fig 4. Effect of the length of treatment during induction of hooking behavior in vivo.
(A) The total number of hooking events during 20 min of mating was counted by observation of superslow movies. (B) Spawned egg numbers per hooking event in each treated group are indicated. Each value represents the mean of the data from three trials with three different males (n = 3). Vertical lines indicate standard deviation. One-way ANOVA was used to assess significant differences among the treated groups. Different letters represent significant differences among the data. b, P value < 0.05, c, P value < 0.01, d, P value < 0.001, e, P value < 0.0001. The mark ‘a’, which indicates that the group did not show significant differences from the control (ethanol, EtOH), is omitted. All the low data represented in the figure is available in S1 Table, also data of statistical analysis is available in S2 Table.

