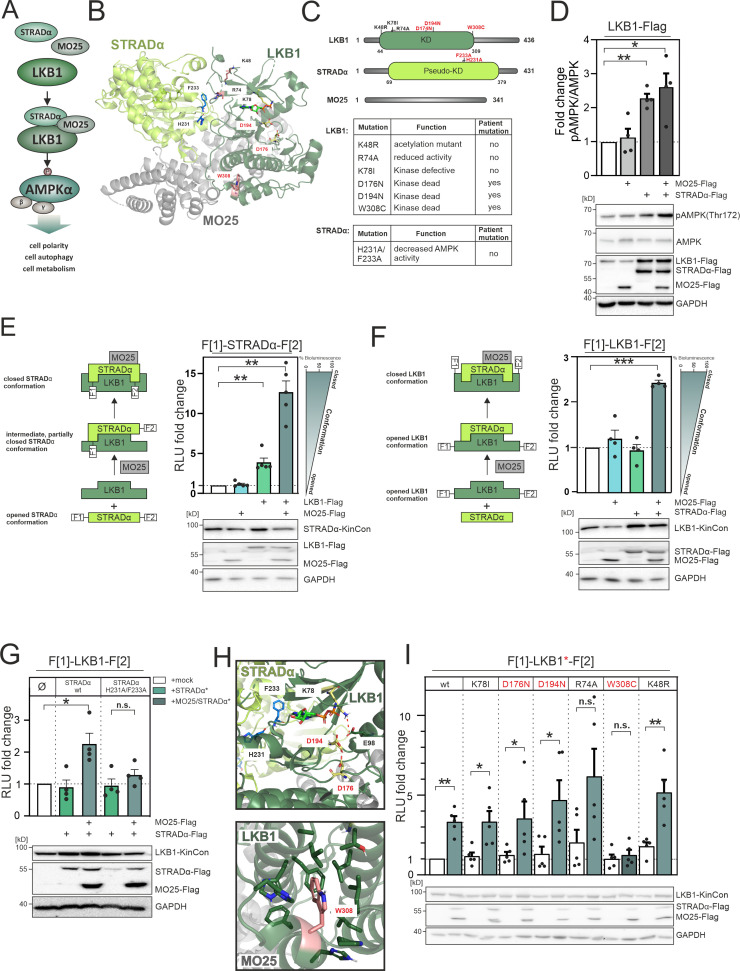
Figure 2. LKB1 emanating complexes and mutation-related kinase activity conformations in intact cells.
(A) Simplified representation of the LKB1-complex composition which promotes AMPKα signaling via phosphorylation at position Thr172. (B) Crystal structure of the LKB1-STRADα-MO25 complex (PDB code 2WTK, Zeqiraj et al., 2009a) representing a snapshot of trimeric complex assembly. The missense mutations we have analyzed are indicated in blue (STRADα) and pale yellow and rose (LKB1). The ATP analogue AMP-PNP is depicted in light green sticks. (C) Domain organization of human LKB1, STRADα, and MO25 (accession numbers: Q15831, Q7RTN6, Q9Y376) with indication of the kinase and pseudokinase domains (KD). Shown in red are tested missense mutations. These are summarized in the table together with their origin and assumed functions (Zubiete-Franco et al., 2019, Qing et al., 2022, Yang et al., 2019, Ui et al., 2014, Al Bakir et al., 2023, Islam et al., 2019, Boudeau et al., 2004). (D) Effect of co-expressions of indicated kinase complex components on AMPK phosphorylation (HeLa cells, 48 hr post transfection) (mean ± SEM, n=4 ind. experiments; 3x-Flag is indicated as flag). (E) Illustration of the kinase conformation (KinCon) reporter setup for STRADα KinCon measurements: Effect of LKB1-STRADα-MO25 complex formation on the STRADα KinCon reporter opening and closing (HEK293T cells, 48 hr post transfection). Expression corrected signals (STRADα-KinCon) are shown (mean ± SEM, n=4 ind. experiments). (F) KinCon reporter setup for LKB1 KinCon measurements: Effect of LKB1-STRADα-MO25 complex formation on the LKB1 KinCon reporter conformation. Expression corrected signals are shown (LKB1-KinCon; HEK293T cells, 48 hr post transfection) (mean ± SEM, n=5 ind. experiments). (G) LKB1-KinCon measurements upon co-expression of indicated proteins displaying the binding deficient STRADα mutations H231A/F233A (HF; see binding interface in B and H). Expression corrected signals are displayed (HEK293T cells, 48 hr post transfection) (mean ± SEM, n=4 ind. experiments). (H) Structure depiction highlights the localization of mutations conferring altered LKB1 functions. LKB1 residues K78, D176, and D194 (pale yellow sticks) are located within the catalytic cleft and in close proximity to AMP-PNP (light green sticks). (I) Impact of LKB1 missense mutations (three patient mutations D176N, D194N, and W308C and three ‘non-patient’ mutations K48R, R74A, K78I) on KinCon conformational changes upon co-expression of interactors. Expression corrected signals are displayed (HEK293T cells, 48 hr post transfection) (mean ± SEM, n=4 ind. experiments). Statistical significance for D, E, F, G, and I: one-sample t-test (*p<0.05, **p<0.01, ***p<0.001).


