. 2024 Aug 1;13:RP94755. doi: 10.7554/eLife.94755

Figure 3. RIPK1 conformation dynamics.

(A) Simplified schematic representations of the activation pathways for apoptosis and necroptosis. Highlighted in black is the combination treatment termed TBZ (10 pg/ml TNFα, 10 nM BV-6, and 20 nM zVAD-FMK) that induces necroptosis. (B) Domain organization of human RIPK1 (accession number: Q13546), RIPK2 (accession number: O43353), RIPK3 (accession number: Q9Y572), and MLKL (accession number: Q8NB16). (C) Basal signals of indicated kinase conformation (KinCon) reporters following transient over-expression in HEK293T cells. Bars represent the RLU fold change relative to RIPK1 (mean ± SD, n=5 ind. experiments). (D) Time-dependent treatments using TBZ of HEK293T cells transiently expressing wild-type (wt) RIPK1 (left) and wt RIPK3 (right) KinCon reporters (expression corrected) (mean ± SD, n=3 ind. experiments). (E) Domain organization of RIPK1 displaying missense mutation sites. (F) 3D structure of RIPK1 dimers with functional mutations highlighted (PDB code: 6HHO, Wang et al., 2018). GSK547 is depicted as brown sticks. (G) KinCon reporter signals with/without mutations (S14/15/166A, S14/15/166E, K45A) were measured in a HEK293T RIPK1 knock-out (KO) cell line (expression corrected) (mean ± SEM, n=5 ind. experiments). (H) KinCon reporter signals of RIPK1 (patient loci: D324A, D324E, D324H, C601Y) were measured in HEK293T RIPK1 KO cells (expression corrected) (mean ± SD, n=5 ind. experiments). (I) 3D structure of RIPK1 with the inhibitor GSK547, which binds to an allosteric site in close proximity to the ATP-binding site (PDB code: 6HHO, Wang et al., 2018). (J) RIPK1 reporter signals with indicated mutations (described in G) upon exposure to GSK547 and Necrostatin 1 μM, and the MEKi Cobimetinib (1 μM, control experiment) or DMSO for 1 hr (mean ± SD, n=6 ind. experiments, HEK293T RIPK1 KO). Statistical significance for C–J: one-sample t-test (*p<0.05, **p<0.01, ***p<0.001).

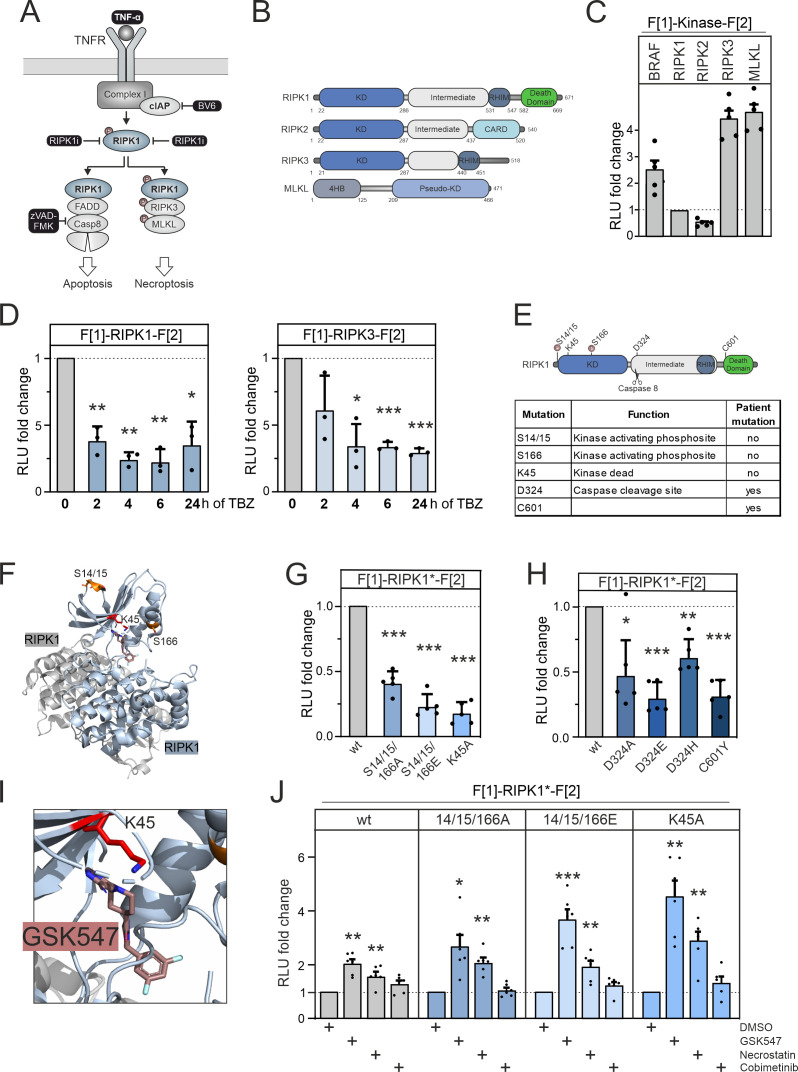
Figure 3—source data 1. Raw unedited western blots underlying Figure 3 and shown in Figure 3—figure supplement 1.
Figure 3—source data 2. Uncropped and labelled western blots Figure 3 and shown in Figure 3—figure supplement 1.

Figure 3.

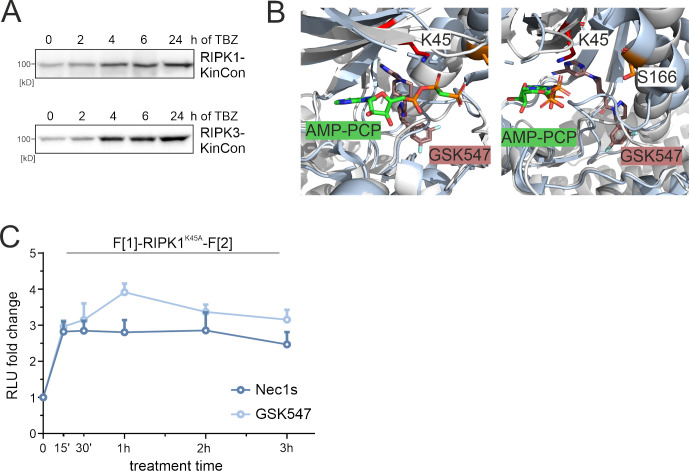
Figure 3—figure supplement 1. Small molecule effects on RIPK1.

Figure 3—figure supplement 1.

(A) Representative western blots of RIPK1 and RIPK3 kinase conformation (KinCon) expressions after TBZ treatment for indicated time points. HEK293T cells were transfected with KinCon constructs and subjected to bioluminescence measurements after 48 hr. (B) 3D structure of RIPK1 with the inhibitor GSK547 (PDB code: 6HHO, Wang et al., 2018), which binds to an allosteric site in close proximity to ATP. For comparison, the structure of RIPK2 (light gray) in complex with the ATP analogue AMP-PCP (green sticks) is aligned (PDB code: 5NG0, Pellegrini et al., 2017). (C) Time-dependent treatment of RIPK1-K45A KinCon with two RIPK1i (GSK547 and Necrostatin, 1 μM each). The KinCon reporter was over-expressed in HEK293T RIPK1 KO cells for 48 hr. Points represent the mean RLU fold change relative to time point zero for n=3 independent experiments with ± SEM.
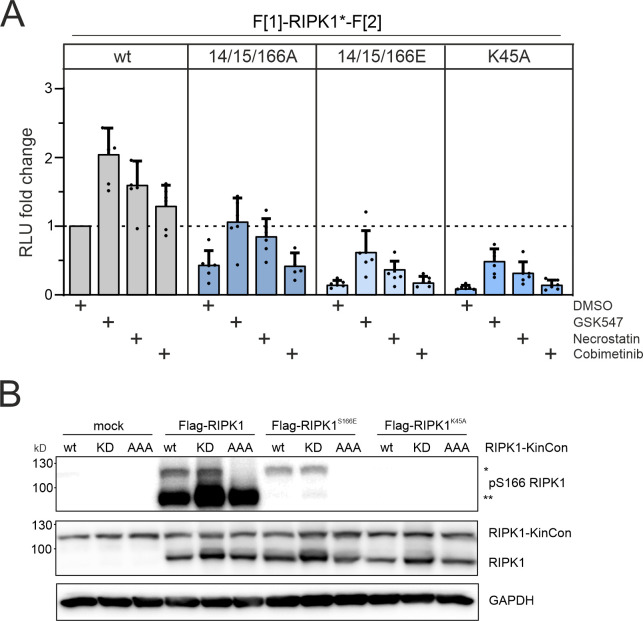
Figure 3—figure supplement 2. Conformation and phosphorylation of RIPK1.

Figure 3—figure supplement 2.

(A) Conformation dynamics of indicated RIPK1 KinCon reporter upon exposure to the two RIPK1i (GSK547 and Necrostatin 1 μM), and the MEKi Cobimetinib (1 μM, control experiment) or DMSO for 1 hr. Bars represent the RLU fold change relative to the DMSO control of wild-type (wt) RIPK1 (mean ± SEM, n=6 ind. experiments, HEK293T RIPK1 KO). (B) RIPK1 KinCon auto-phosphorylation with co-expressed Flag-tagged RIPK1 constructs following expression in HEK293T RIPK1 KO cells. Indicated RIPK1 wt or mutant constructs were co-expressed for 48 hr and subjected to western blotting. KinCon RIPK1 constructs are annotated with single asterisk and Flag-tagged RIPK1 with double asterisks.
Figure 3—figure supplement 2—source data 1. Raw unedited western blots shown in Figure 3—figure supplement 2.
Figure 3—figure supplement 2—source data 2. Uncropped and labelled western blots shown in Figure 3—figure supplement 2.