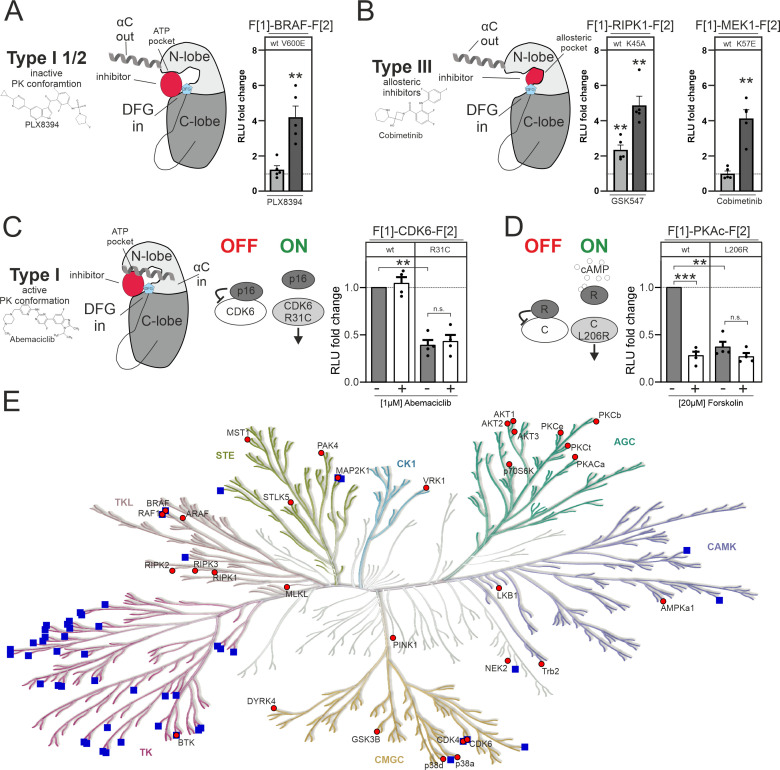
Figure 5. Impact of small molecules and protein interactions on kinase activity conformations.
(A+B) Depiction of molecular interactions of a type I 1/2 and type III kinase inhibitors with a kinase domain (N and C lobe). Impact of PLX8394, Cobimetinib and GSK547 on wild-type (wt) and mutated versions of BRAF, RIPK1, and MEK1 kinase conformation (KinCon) reporters. 48 hr post transfection HEK293T cells expressing respective reporter constructs were treated with indicated inhibitors for 1 hr (1 μM) followed by RLuc PCA analyses (mean ± SEM, n=4/5 ind. experiments). (C) Depiction of molecular interactions of a type I kinase inhibitor with a kinase domain (N and C lobe). Impact of Abemaciclib on indicated CDK6 kinase conformations (wt and p16INK4a binding deficient). 48 hr post transfection HEK293T cells expressing respective reporter constructs were treated with indicated inhibitors for 3 hr (1 μM) followed by RLuc PCA analyses (mean ± SEM, n=4 ind. experiments). (D) Bioluminescence measurement of PKAc wt and L206R KinCon reporters. HEK293T cells expressing the reporter were treated with 20 μM of Forskolin for 15 min followed by RLuc PCA analyses (mean ± SEM, n=4 ind. experiments). (E) Kinome tree displays kinases for which KinCon reporters have been generated (red dots). The blue squares highlight the kinases for which approved drugs are available. Generated with https://kinhub.org/kinmap/. Statistical significance for A–D: one-sample t-test (*p<0.05, **p<0.01, ***p<0.001).


