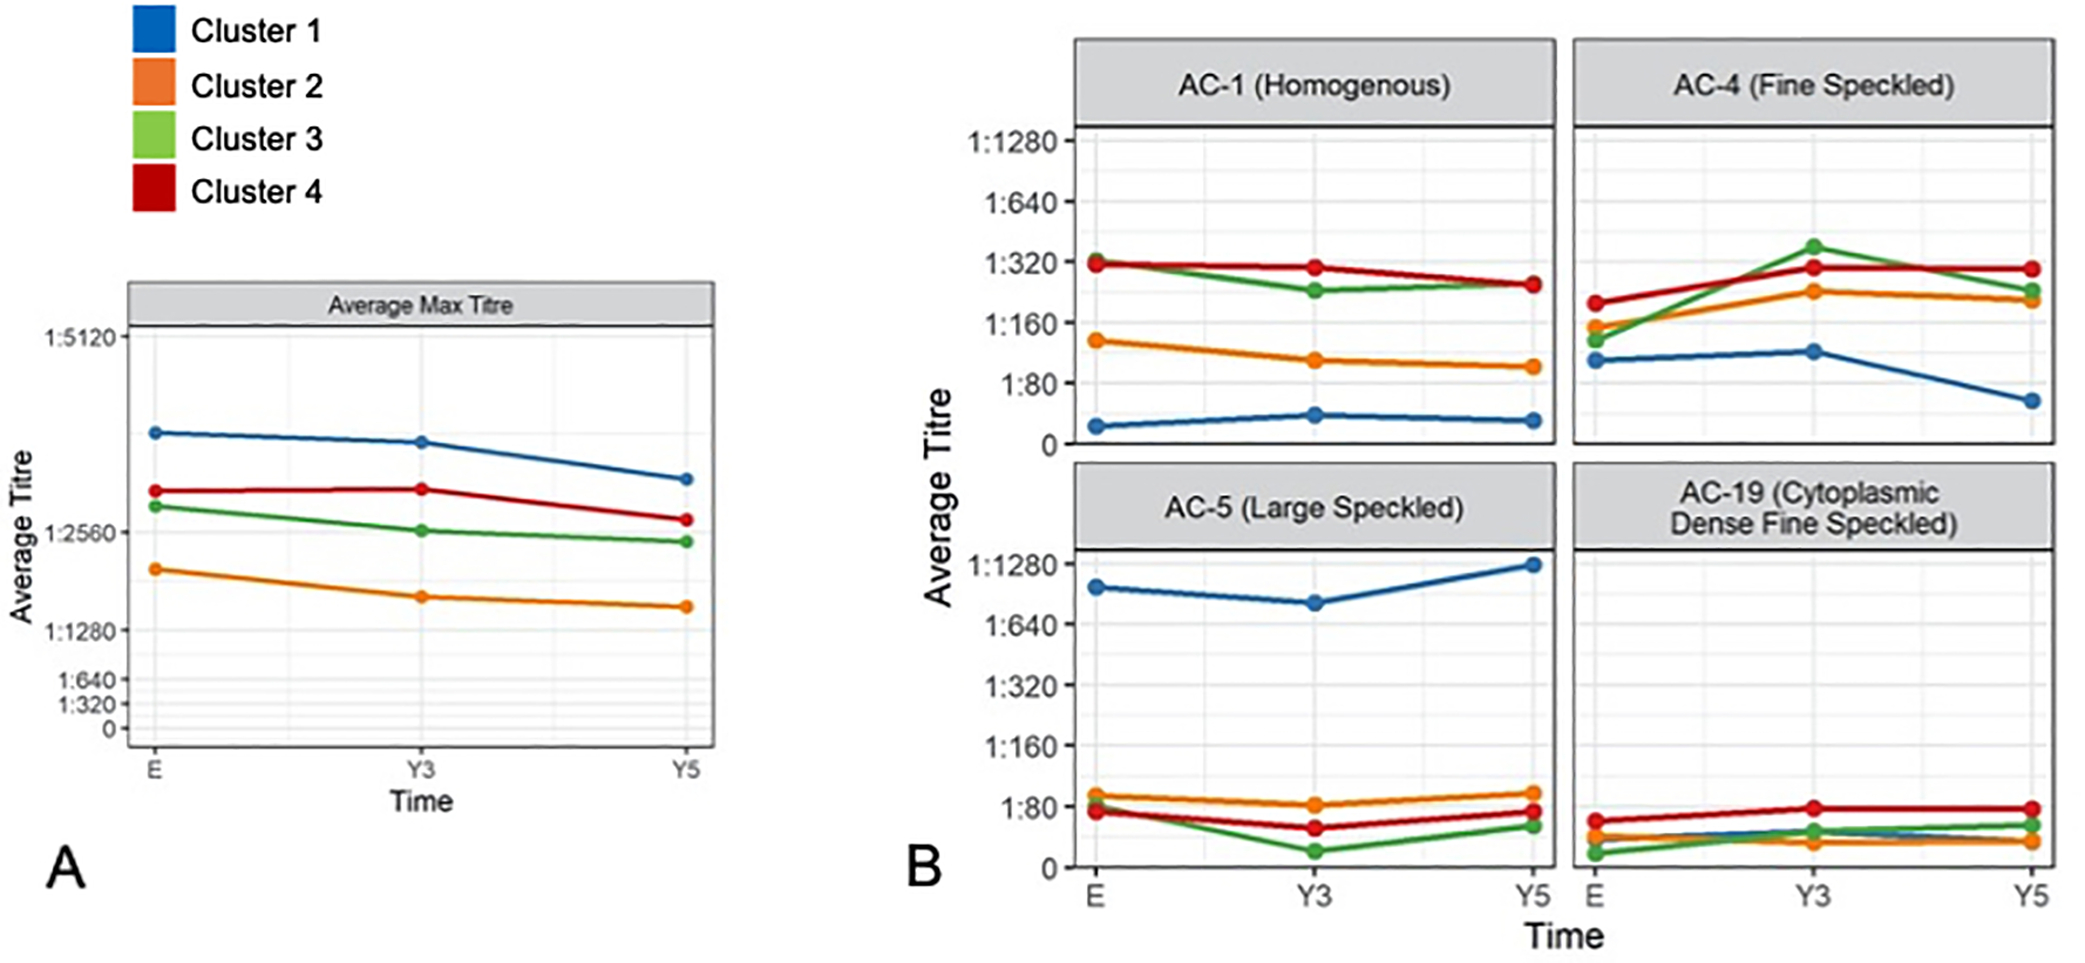
Figure 3. ANA titres and patterns for each cluster.

A) Mean maximum ANA titers slightly decreased over time. Cluster 1 (anti-Sm/RNP) highest mean maximum ANA titer. Cluster 2 (low anti-dsDNA) lowest mean maximum ANA titer. B) AC-1 (homogeneous pattern associated with anti-dsDNA, histones), AC-4 (fine speckled associated with anti-SSA/Ro60, anti-SSB/La), and AC- 19 (cytoplasmic dense fine speckled associated with anti-ribosomal P) correspond to the autoantibody profile observed in cluster 4. High titres of AC-5 (large specked associated with anti-Sm and anti-U1RNP antibodies) correspond to cluster 1 antibody profile. Remaining AC patterns had mean titers <1:80 at all three visits for all cluster groups.
