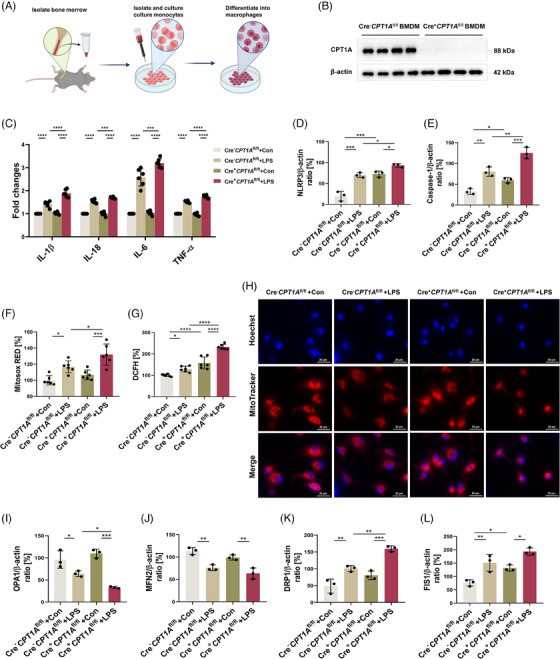
FIGURE 2.

CPT1A regulates aberrant inflammation and mitochondrial stability in macrophages upon LPS challenge. (a) Schematic diagram of the extraction, separation and cultivation of BMDMs in vitro. Some figure elements were created with BioRender.com. (b) Macrophage CPT1A depletion was verified by immunoblotting in BMDMs from Cre− CPT1A fl/fl and Cre+ CPT1A fl/fl mice. n = 4 biologically independent samples. (c) After LPS stimulation (100 ng/mL) for 6 h, the induction of cytokines IL‐1β, IL‐18, IL‐6 and TNF‐α mRNA expression in each group was analysed by qRT‐PCR. Data are expressed as fold change. n = 6 biologically independent samples. ***p = .0007, ***p = .0004, ****p < .0001. (d, e) After LPS (100 ng/mL) treatment for 24 h, quantitative immunoblotting analysis indicating the effect of CPT1A expression on NLRP3/Caspase‐1 p10 level for inflammasome activation in BMDMs. n = 3 biologically independent samples. (d) ***p = .0002 (Cre− CPT1A fl/fl+Con group vs. Cre− CPT1A fl/fl+LPS group), ***p = .0001 (Cre− CPT1A fl/fl+Con group vs. Cre+ CPT1A fl/fl+Con group), *p = .0451 (Cre+ CPT1A fl/fl+Con group vs. Cre+ CPT1A fl/fl+LPS group), *p = .0243 (Cre− CPT1A fl/fl+LPS group vs. Cre+ CPT1A fl/fl+LPS group). (e) **p = .0015 (Cre− CPT1A fl/fl+Con group vs. Cre− CPT1A fl/fl+LPS group), *p = .0411, ***p = .0002, **p = .0023 (Cre− CPT1A fl/fl+LPS group vs. Cre+ CPT1A fl/fl+LPS group). (f, g) Microplate reader assay showing the effect of CPT1A on the production of mitochondrial (f) and intracellular ROS (g) induced by LPS (100 ng/mL) in BMDMs. n = 6 biologically independent samples. (f) *p = .0114 (Cre− CPT1A fl/fl+Con group vs. Cre− CPT1A fl/fl+LPS group), ***p = .0002, *p = .0243. (g) *p = .0268, ****p < .0001. (h) Confocal microscopy images showing the mitochondrial mass of BMDMs from each group using MitoTracker probe. Scale bars, 20 µm. (i–l) Quantitative immunoblotting analysis indicating the effect of CPT1A on the expression of OPA1, MFN2, DRP1 and FIS1 for mitochondrial dynamics in BMDMs. n = 6 biologically independent samples. (i) *p = .013 (Cre− CPT1A fl/fl+Con group vs. Cre− CPT1A fl/fl+LPS group), ***p = .0002 (Cre+ CPT1A fl/fl+Con group vs. Cre+ CPT1A fl/fl+LPS group), *p = .0397 (Cre− CPT1A fl/fl+LPS group vs. Cre+ CPT1A fl/fl+LPS group). (j) **p = .0026 (Cre− CPT1A fl/fl+Con group vs. Cre− CPT1A fl/fl+LPS group), **p = .0035 (Cre+ CPT1A fl/fl+Con group vs. Cre+ CPT1A fl/fl+LPS group). (k) **p = .0063 (Cre− CPT1A fl/fl+Con group vs. Cre− CPT1A fl/fl+LPS group), **p = .0028 (Cre− CPT1A fl/fl+LPS group vs. Cre+ CPT1A fl/fl+LPS group), ***p = .0004. (l) *p = .027 (Cre− CPT1A fl/fl+Con group vs. Cre+ CPT1A fl/fl+Con group), *p = .0154 (Cre+ CPT1A fl/fl+Con group vs. Cre+ CPT1A fl/fl+LPS group), **p = .0049. Data are presented as mean ± SEM and analysed with a 95% confidence interval. p Values were calculated using one‐way ANOVA followed by Bonferroni's post hoc test.
