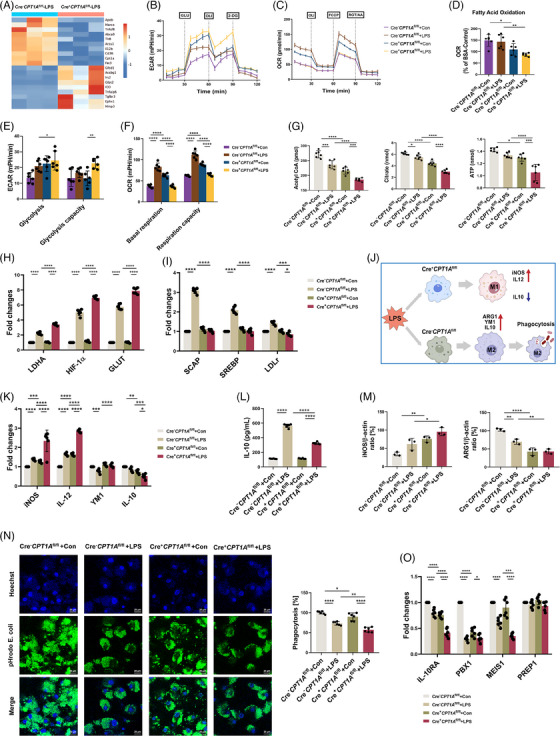
FIGURE 3.

CPT1A modulates metabolic reprogramming from glycolysis to FAO, polarisation and IL‐10 production in LPS‐stimulated macrophages. (a) Heat map of DEGs in Cre− CPT1A fl/fl and Cre+ CPT1A fl/fl BMDMs after 12 h stimulation with LPS (100 ng/mL). (b, c) ECAR and OCR of BMDMs from Cre− CPT1A fl/fl and Cre+ CPT1A fl/fl mice were measured with a Seahorse XFe96 analyser. Where indicated, cells were injected with 10 mM glucose (GLU), 1 µM oligomycin (OLI) and 100 mM 2‐DG sequentially for ECAR (b). For OCR, BMDMs were pretreated with 170 µM palmitate‐BSA FAO substrate or 40 µM CPT1A inhibitor Etomoxir, followed by injection of 2 µM OLI, 1 µM FCCP, and a combination of .5 µM rotenone and antimycin A (AA) at the time points indicated (c). n = 6 biologically independent samples at each data point. (d–f) The FAO level (d), glycolysis level and glycolysis capacity (e), and basal respiration and respiration capacity (f) of BMDMs from Cre− CPT1A fl/fl and Cre+ CPT1A fl/fl mice with or without LPS stimulation. n = 6 biologically independent samples. (d) *p = .0312, **p = .0019. (e) *p = .0329, **p = .0022. (f) ****p < .0001. (g) After 12 h treatment with LPS (100 ng/mL) in BMDMs, levels of intracellular FAO metabolites, acetyl CoA and citrate, as well as ATP were measured. n = 6 biologically independent samples. Acetyl CoA, ***p = .0001 (Cre− CPT1A fl/fl+Con group vs. Cre− CPT1A fl/fl+LPS group), ***p = .0006 (Cre+ CPT1A fl/fl+Con group vs. Cre+ CPT1A fl/fl+LPS group), ****p < .0001. Citrate, *p = .0241, ****p < .0001. ATP, *p = .0449, ***p = .0001, ****p < .0001. (h, i) Induction of LDHA, HIF‐1α, GLUT, SCAP, SREBP and LDLr mRNA expression in Cre− CPT1A fl/fl or Cre+ CPT1A fl/fl BMDMs was estimated by qRT‐PCR. Data are expressed as fold change. n = 6 biologically independent samples. (h) ****p < .0001. (i) *p = .0147, ***p = .0002, ****p < .0001. (j) Diagram of the modulatory effects of CPT1A on macrophage activation and polarisation upon LPS stimulation. Some figure elements were created with BioRender.com. (k) Induction of iNOS, IL‐12, YM1 and IL‐10 mRNA expression in Cre− CPT1A fl/fl or Cre+ CPT1A fl/fl BMDMs was analysed via qRT‐PCR. Data are expressed as fold change. n = 6 biologically independent samples. iNOS, ***p = .0002, ****p < .0001. IL‐12, ****p < .0001. YM1, ***p = .0002, ****p < .0001. IL‐10, **p = .0012, ***p = .0005, *p = 0.0443. (l) The secretion level of IL‐10 by BMDMs was examined by ELISA assay 24 h after LPS stimulation (100 ng/mL). n = 6 biologically independent samples. ****p < .0001. (m) Quantitative immunoblotting analysis indicating the effect of CPT1A on ARG1 and iNOS expression for macrophage polarisation in BMDMs. n = 3 biologically independent samples. iNOS, **p = .007, *p = .021. ARG1, **p = .0024 (Cre− CPT1A fl/fl+Con group vs. Cre− CPT1A fl/fl+LPS group), **p = .0082 (Cre− CPT1A fl/fl+LPS group vs. Cre+ CPT1A fl/fl +LPS group), ****p < .0001. (n) The phagocytic capacity of BMDMs from Cre− CPT1A fl/fl or Cre+ CPT1A fl/fl mice was evaluated by use of the pHrod Green E. coli BioParticles through both confocal microscopy (showed in the left panel; scale bars, 20 µm) and fluorescence plate reader (showed in the right panel). n = 6 biologically independent samples. *p = .045, **p = .0013, ****p < .0001. (o) The levels of IL‐10RA, PBX1, MEIS1 and PREP1 mRNA expression in BMDMs were analysed by qRT‐PCR. Data are expressed as fold change. n = 6 biologically independent samples. IL‐10RA, ****p < .0001. PBX1, *p = .0196, ****p < .0001. MEIS1, ***p = .0004, ****p < .0001. Data are presented as mean ± SEM and analysed with a 95% confidence interval. p Values were calculated using one‐way ANOVA followed by Bonferroni's post hoc test.
