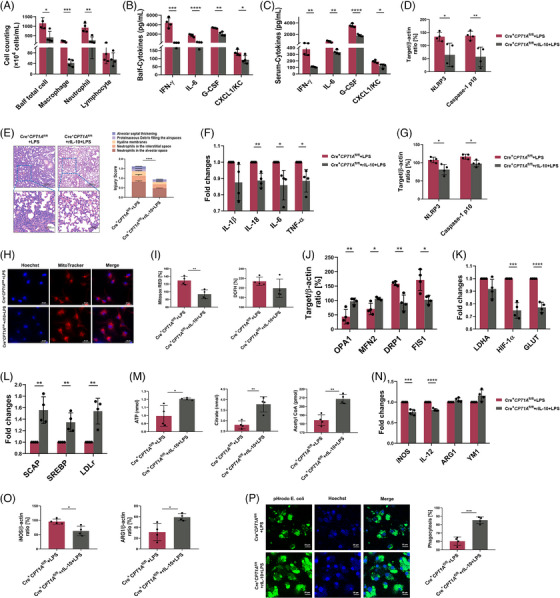
FIGURE 6.

Exogenous IL‐10 supplement reverses the aggravated ALI, macrophages metabolic alterations and polarisation caused by CPT1A deficiency in LPS‐stimulated model. (a) Exogenous rIL‐10 (45 µg/kg) was administrated to Cre+ CPT1A fl/fl mice simultaneously with LPS (10 mg/kg) challenge. After 24 h, mice were euthanised and Balf was collected and estimated for total cell number, macrophage, neutrophil, and lymphocyte numbers. n = 4 biologically independent samples. *p = .0133, ***p = .0006, **p = .0041. (b, c) Production of cytokines IFN‐γ, IL‐6, G‐CSF, and CXCL1/KC in Balf and serum was assessed via ELISA kits. n = 4 biologically independent samples. (b) ***p = .0002, ****p < .0001, **p = .0011, *p = .031. (c) **p = .0013, **p = .0017, ****p < .0001, *p = .0144. (d) Quantitative immunoblotting analysis indicating the protective effect of rIL‐10 on the NLRP3/Caspase‐1 activation for lung inflammation in Cre+ CPT1A fl/fl mice. n = 4 biologically independent samples. *p = .0272, **p = .0072. (e) Representative images of H&E‐stained lung tissue sections of Cre+ CPT1A fl/fl mice after LPS challenge with or without rIL‐10 treatment. Scale bars in the upper panel, 200 µm; scale bars in the lower panel, 50 µm. n = 4 biologically independent samples. ****p < .0001. (f) After LPS stimulation for 6 h with or without rIL‐10 pretreatment, the mRNA expressions of cytokines IL‐1β, IL‐18, IL‐6 and TNF‐α in Cre+ CPT1A fl/fl BMDMs were examined by qRT‐PCR. Data are expressed as fold change. n = 4 biologically independent samples. **p = .0021, *p = .0206, *p = .0157. (g) Quantitative immunoblotting analysis showing the effect of rIL‐10 on the NLRP3/Caspase‐1 activation for macrophage inflammation after 24 h of LPS stimulation. n = 4 biologically independent samples. NLRP3, *p = .0166, Caspase‐1 p10, *p = .0145. (h) Confocal microscopy images showing the mitochondrial mass of BMDMs from each group using MitoTracker probe. Scale bars, 20 µm. (i) Microplate reader assay exhibiting the effect of rIL‐10 on mitochondrial and intracellular ROS production induced by LPS in Cre+ CPT1A fl/fl BMDMs. n = 4 biologically independent samples. **p = .004. (j) Quantitative immunoblotting analysis indicating the effect of rIL‐10 on the expression of OPA1, MFN2, DRP1 and FIS1 for mitochondrial dynamics in Cre+ CPT1A fl/fl BMDMs. n = 4 biologically independent samples. OPA1, **p = .0082. MFN2, *p = .0124. DRP1, **p = .0032. FIS1, *p = .013. (k, l) Induction of LDHA, HIF‐1α and GLUT (k), as well as SCAP, SREBP and LDLr (l) mRNA expression in Cre+ CPT1A fl/fl BMDMs with or without rIL‐10 addition was estimated by qRT‐PCR. Data are expressed as fold change. n = 4 biologically independent samples. (k) HIF‐1α, ***p = .0002, GLUT, ****p < .0001. (l) SCAP, **p = .0029, SREBP, **p = .0053, LDLr, **p = .0029. (m) After 12 h treatment with LPS with or without rIL‐10 supplement in BMDMs, production of ATP, as well as intracellular FAO metabolites, citrate and acetyl CoA were measured. n = 4 biologically independent samples. ATP, *p = .0173. citrate, **p = .0011. Acetyl CoA, **p = .003. (n) Induction of iNOS, IL‐12, ARG1 and YM1 mRNA expression in Cre+ CPT1A fl/fl BMDMs was analysed via qRT‐PCR. Data are expressed as fold change. n = 4 biologically independent samples. iNOS, ***p = .0003. IL‐12, ****p < .0001. (o) Quantitative immunoblotting analysis verifying the effect of rIL‐10 on iNOS and ARG1 expression for macrophage polarisation in Cre+ CPT1A fl/fl BMDMs upon LPS challenge. n = 4 biologically independent samples. iNOS, *p = .0142. ARG1, *p = .0179. (p) The phagocytic capacity of Cre+ CPT1A fl/fl BMDMs with or without rIL‐10 treatment was evaluated by the pHrod Green E. coli BioParticles through both confocal microscopy (showed in the upper panel; scale bars, 20 µm) and fluorescence plate reader (showed in the lower panel). n = 4 biologically independent samples. ***p = .0002. Data are presented as mean ± SEM and analysed with a 95% confidence interval. p Values were calculated using unpaired Student's t‐test.
