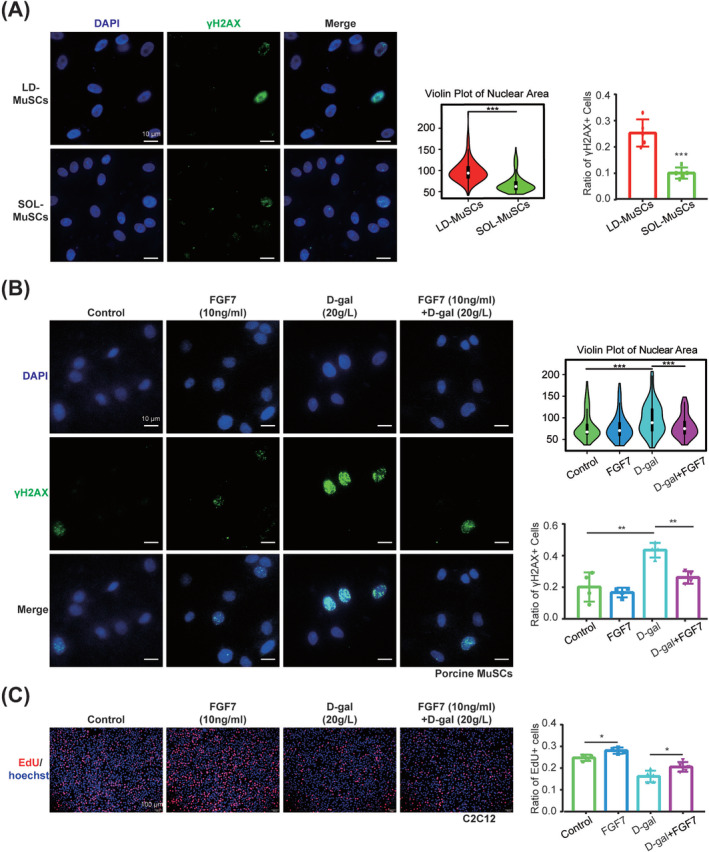
Figure 7.

FGF7 delayed myogenic cell senescence. (A) Immunofluorescence staining with γH2AX (green) and DAPI (blue) was detected in synchronously cultured passage 15 LD‐MuSCs and SOL‐MuSCs, and the nuclear area (n = 200 nuclei) and ratio of γH2AX+ cells (n = 5 samples) were quantified. The scale bar is 10 μm. (B) Immunofluorescence staining with γH2AX (green) and DAPI (blue) was detected in porcine MuSCs treated with 10‐ng/mL FGF7 recombinant protein, 20‐g/L d‐gal and 20‐g/L d‐gal + 10‐ng/mL FGF7, and the nuclear area (n = 200 nuclei) and ratio of γH2AX+ cells (n = 4 samples) were quantified. The scale bar is 10 μm. (C) Immunofluorescence staining with EdU (red) and Hoechst (blue) was detected in C2C12 treated with 10‐ng/mL FGF7 recombinant protein, 20‐g/L d‐gal and 20‐g/L d‐gal + 10‐ng/mL FGF7, and the ratio of EdU+ cells was quantified. The scale bar is 100 μm (n = 5) (*P < 0.05, ** P < 0.01 and *** P ≤ 0.001). Data are presented as mean ± SD.
