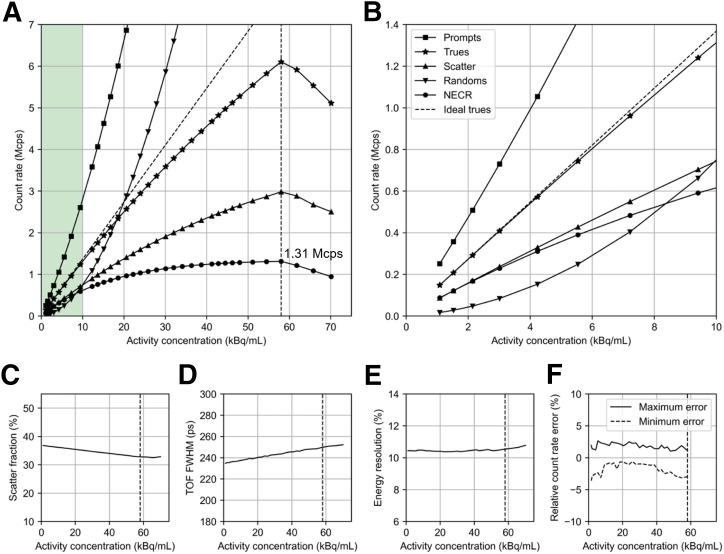
FIGURE 3.
Count-rate performance of NX. (A) Prompts, trues, scatter, randoms, and noise-equivalent count rate. (B) Zoomed display of A at ∼0–10 kBq/mL, which corresponds to typical activity level for human brain imaging. (C) Scatter fraction. (D) TOF resolution. (E) Energy resolution. (F) Relative count rate error as function of activity concentration. Vertical dashed line denotes noise-equivalent count rate peak position at 58.0 kBq/mL, corresponding to 1,275 MBq (34.5 mCi). NECR = noise-equivalent count rate.

