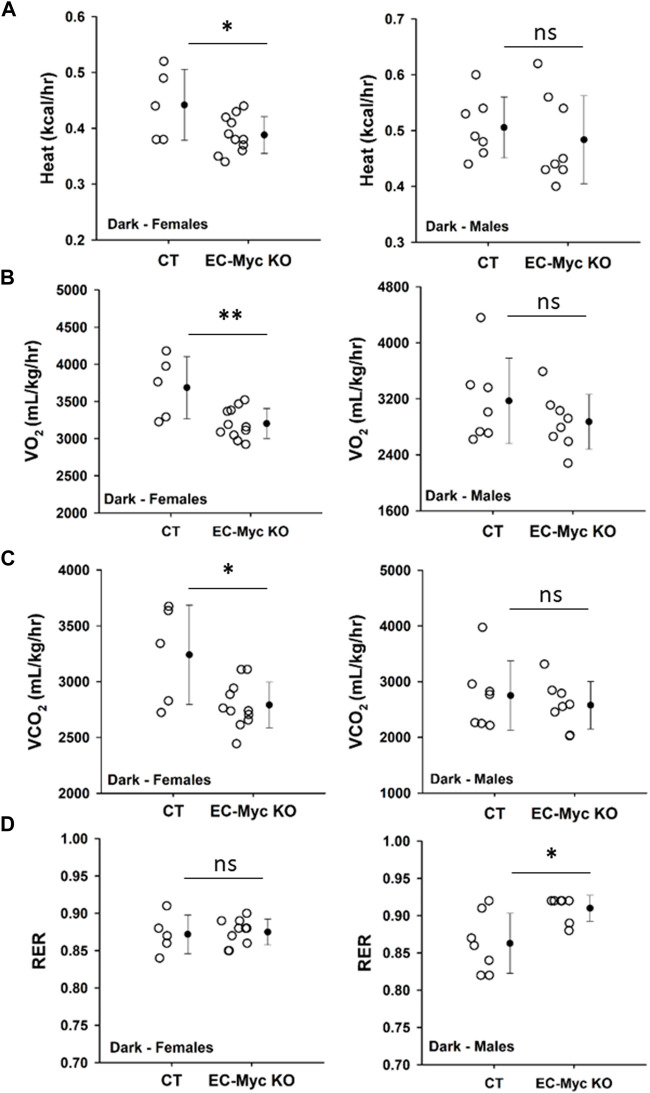
FIGURE 4.
Metabolic phenotype of control and endothelial c-Myc knockout mice by indirect calorimetry. (A) Heat production. (B) Volume of oxygen consumed (VO2). (C) Volume of carbon dioxide release (VCO2). (D) Respiratory exchange ratio (RER). Dots represent individual animals and filled circles represent the mean ± standard deviation. CT, Control (n = 5–7); EC-Myc KO, Endothelial c-Myc Knockout (n = 7–11); ns, non-significant. *p < 0.05, **p < 0.01.

