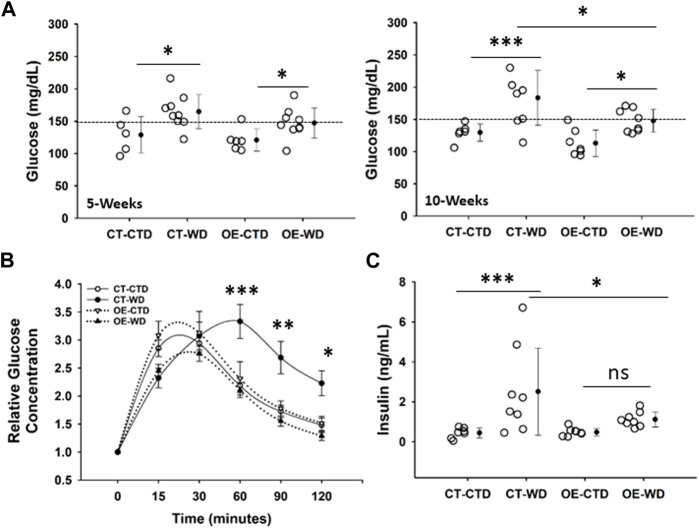
FIGURE 7.
Analysis of glucose tolerance in control and endothelial c-Myc overexpression mice under exposure to western diet. (A) Basal glucose levels at 5- and 10-weeks. (B) Glucose tolerance test at 10-weeks. White and black symbols represent animals exposed to control and western diet, respectively. (C) Quantification of systemic insulin levels at 10-weeks endpoint. In B, results are expressed as fold change relative to baseline and represent the mean ± standard error. In all other graphs, dots represent individual animals and filled circles represent the mean ± standard deviation. CT, Control; OE, Endothelial c-Myc overexpression; CTD, control diet (n = 6–7); WD, western diet (8-9). *p < 0.05, **p < 0.005, ***p < 0.001.

