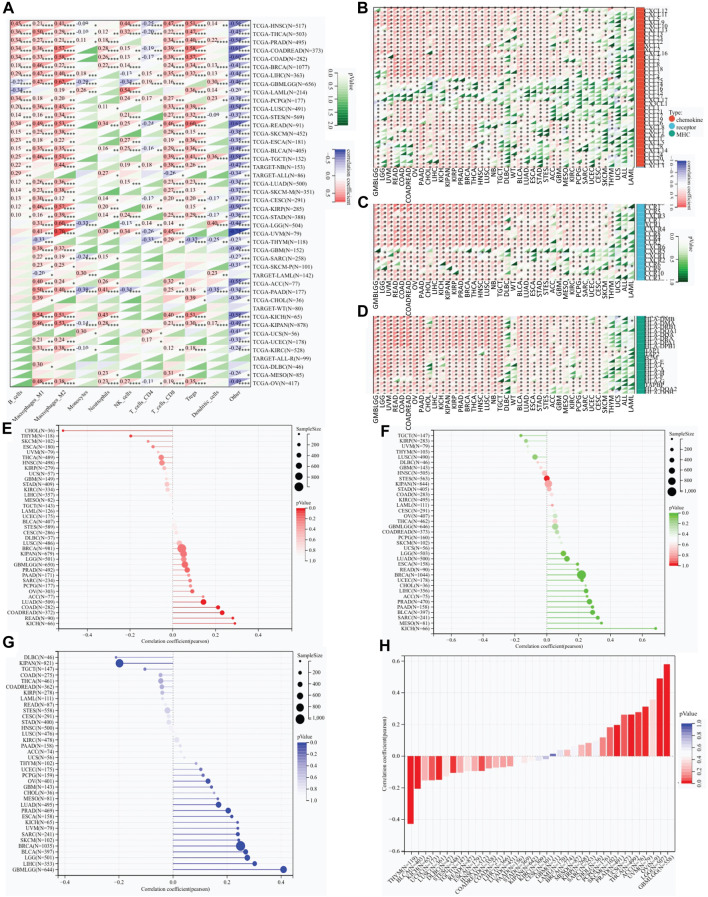
FIGURE 4.
RAB42 overexpression correlates with the infiltration of immune cells. (A) Correlation analysis of RAB42 expression with immune cell infiltration in pan-cancer by predicting the treatment response to ICIs. A QUANTISEQ algorithm. *p < 0.05; **p < 0.01; ***p < 0.001; ****p < 0.0001. (B–D) Expression correlation analysis of RAB42 with immunomodulatory genes: chemokines (B), chemokine receptors (C), and MHCs (D). (E–H) Correlation analysis of RAB42 expression with (E) TMB, (F) HRD, (G) LOH and (H) stemness scores.

