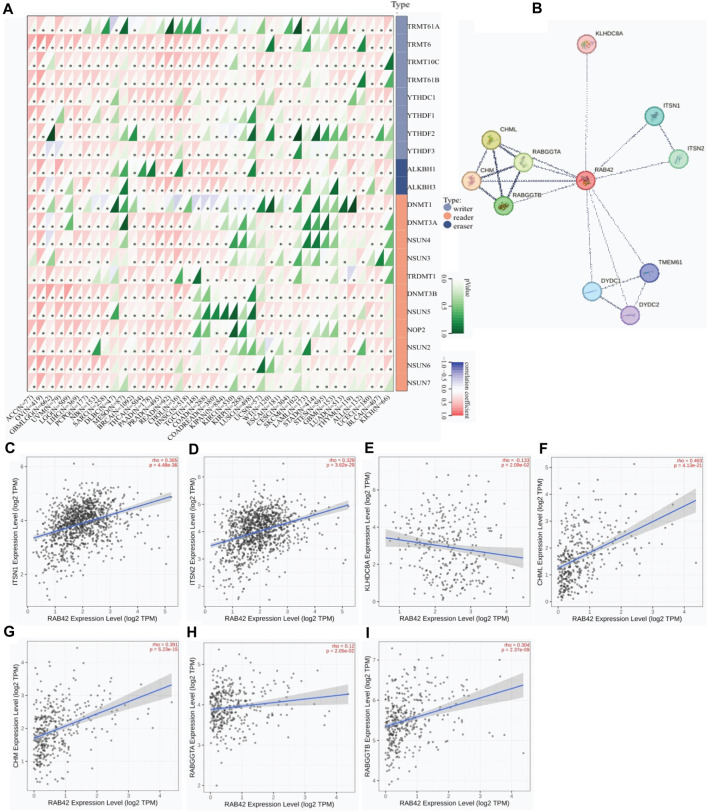
FIGURE 5.
Protein-protein interaction network analysis of RAB42 in pan-cancer. (A) Expression correlation analysis of RAB42 with m6A RNA MRGs. *p < 0.05. (B) PPI network analysis of RAB42 in pan-cancer. (C,D) Expression correlation analysis of RAB42 with ITSN1 or ITSN2 in BRCA. (E) Expression correlation analysis of RAB42 with KLHDC8A in OV. (F–I) Expression correlation analyses of RAB42 with CHML, CHM, RABGGTA and RABGGTB in LIHC.

