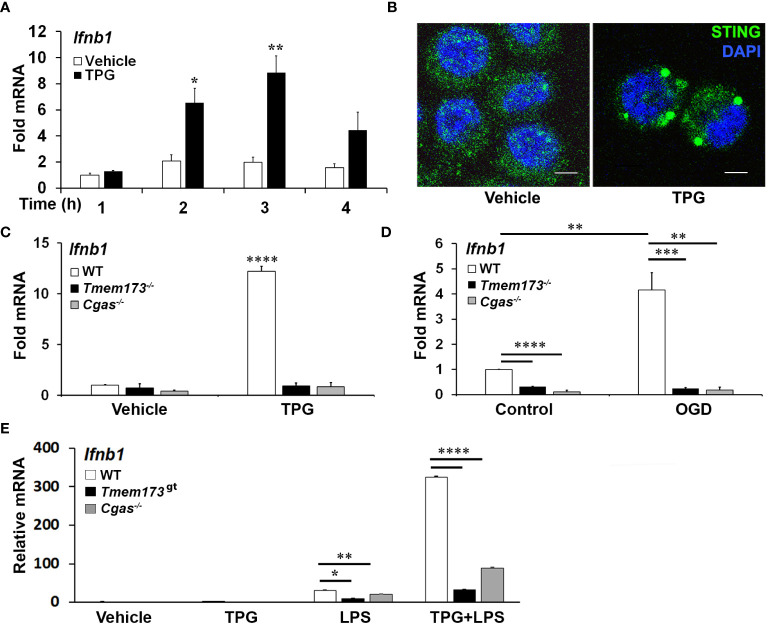
Figure 1.
ER stress-dependent Ifnb1 (IFN-β) mRNA expression during TPG treatment and oxygen glucose deprivation (OGD) requires both STING and cGAS. (A) iMacs were treated with 1μM TPG (black bars) or DMSO vehicle control (open bars) for the specified times. Ifnb1 mRNA expression was determined by quantitative (q) PCR, normalized to 18S RNA and to vehicle treated control (set=1). *P<0.05 and **p<0.01 comparing TPG and DMSO samples within time points. (B) HeLa cells were treated with 1μM TPG for 3h, fixed, and incubated with anti-STING followed by anti-mouse IgG Alexa Fluor 488 (green), and then stained with DAPI (blue nuclei). Visualization was by immunofluorescence microscopy. Scale bars are 5 μm (C) Wild type (WT, open bars) STING (Tmem173)-/- (black bars) and Cgas -/- (gray bars) iMacs were treated with 1μM TPG for 3h and Ifnb1 mRNA quantified as above. ****P<0.001 in treated WT vs. all knockouts and vehicle control. RNA levels were normalized to vehicle treated WT control (set=1) (D) iMacs were subject to oxygen glucose deprivation (OGD) for 2h and IFN-β expression was quantitated with qPCR as above, with fold RNA vs WT control. ****p<0.001, ***p<0.005 and **p<0.01. (E) WT, Cgas -/- or STING null mutant (Golden Ticket, Tmem173gt ) macrophages were stimulated with 1μM TPG for 1h and then 10ng/mL LPS for 3h prior to harvest for RNA. RNA levels were normalized to 18S RNA. Bars represent means of 2-3 (E), 3 (A, D) or 5 (C) independent experiments and errors are SEM.

