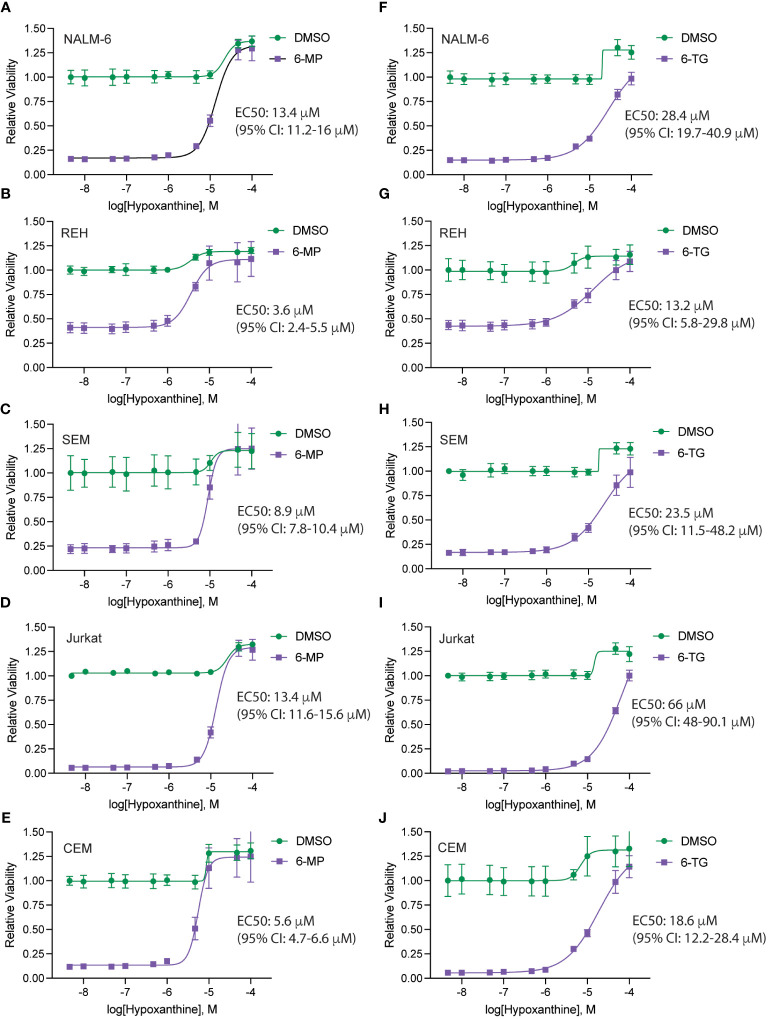
Figure 6.
Hypoxanthine concentrations required to rescue thiopurine toxicity. Hypoxanthine dose-response curves for leukemia cells (NALM-6, A, F; REH, B, G; SEM, C, H; Jurkat, D, I; CEM, E, J) in the presence of 6-MP 4.7 μM (A–E) or 6-TG 4.7 μM (F–J). Leukemia cell viability was assessed after 48 hours of drug treatment using the CellTiter-Glo Luminescent Cell Viability Assay. Error bars represent the mean ± SD of three technical replicates. EC50 values with confidence intervals were calculated from the dose-response curves and are shown for each cell line.

