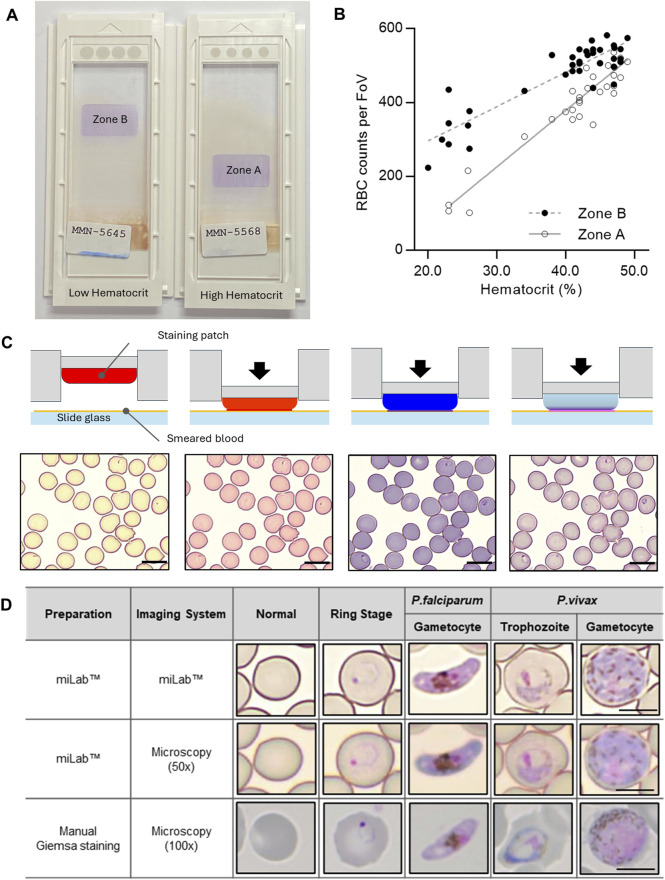
FIGURE 2.
Characterization of the blood film in the miLab™. (A) Photograph of the prepared blood films from the miLab™ using a patient specimen with low hematocrit and high hematocrit from Malawi. Low hematocrit samples to be read in Zone B instead of Zone A, where high hematocrit samples were read. The miLab™ device automatically detects an appropriate area to observe RBCs in a monolayer. (B) Correlation of average RBC counts per FoV depending on the hematocrit of the clinical specimens (n = 37) was shown with open dots (Zone A) and close dots (Zone B). (C) Schematic of blood staining using three distinct staining patches in the cartridge and pictures of stained blood cells with Plasmodium-infected RBCs (black arrow) from each step of the staining procedure. The scale bars = 10 μm. (D) Comparison of microscopic cell image with the miLab™ blood film acquired from miLab™, 50x olympus microscopy with miLab™ blood film, and 100x microscopy with conventional Giemsa slides. The scale bars = 5 μm.

