FIGURE 3.
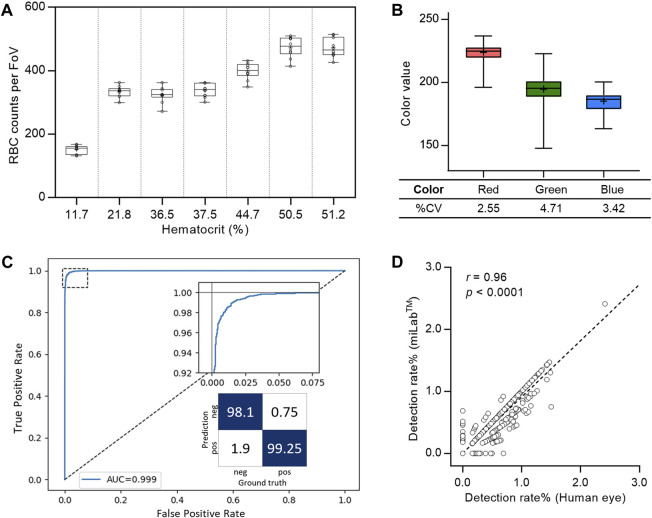
System verification of the miLab™ device. (A) Reproducibility of blood smear was represented with the box plot using RBC counts per FoV in seven clinical specimens (n = 20). Average RBC counts per FoV were demonstrated with low, middle, and high hematocrits. The RBC counts of the samples with the low (<30%) and the middle/high hematocrits (>30%) were selected from Zones B and A, respectively. (B) Reproducibility of blood staining was represented with the box plot using the red, green, and blue color value, which was obtained from the stained RBCs in FoVs of clinical specimens. The RGB color values of each RBC was conserved across FoVs (n = 4,000). (C) Cellular level classification performance for Plasmodium (ring, gametocytes) was represented with the ROC curve. The area under the curve (AUC) was 0.999 with 95% confidence interval in the range of 0.9986–0.9994. The confusion matrix was calculated at the optimal point where maximum accuracy was obtained. (D) Correlation of the detection rate of malaria positives (ring, gametocytes) between the deep learning algorithm (test group: miLab™) and naked eyes (control group: Microscopy) with the Pearson’s correlation coefficient (r) of 0.96 (p < 0.0001, n = 3,000).

