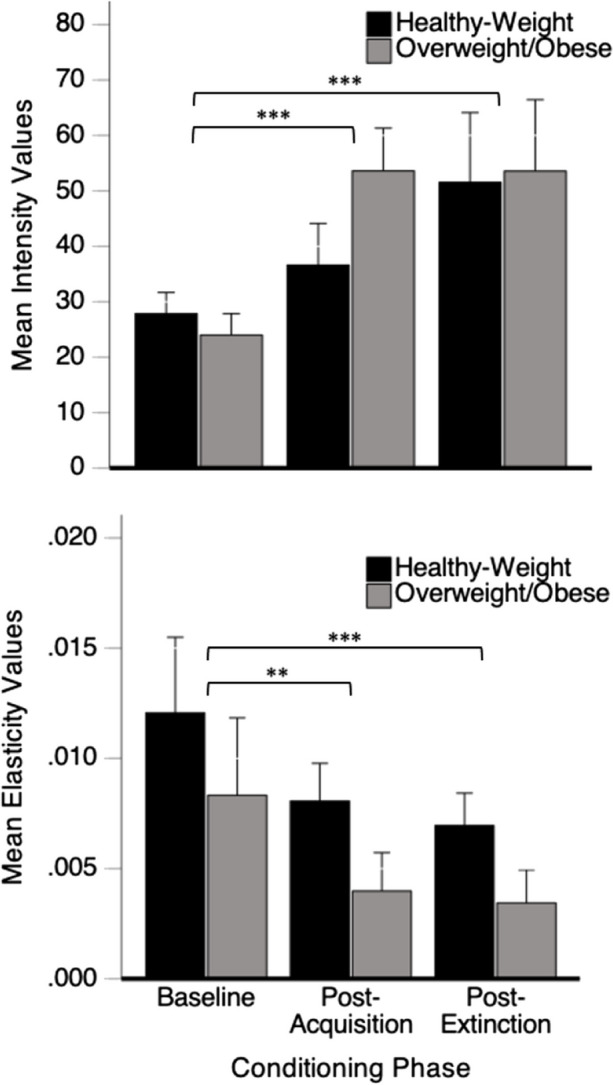
Fig. 6.

Mean Intensity (Q0 Values; Top) and Demand Elasticity (α Values; Bottom) as a Function of Condition and Obesity Status (Healthy-Weight = Black; Overweight/Obese = Grey). Note. Error bars represent 1 SEM.** p < 0.01; *** p < 0.001

Mean Intensity (Q0 Values; Top) and Demand Elasticity (α Values; Bottom) as a Function of Condition and Obesity Status (Healthy-Weight = Black; Overweight/Obese = Grey). Note. Error bars represent 1 SEM.** p < 0.01; *** p < 0.001