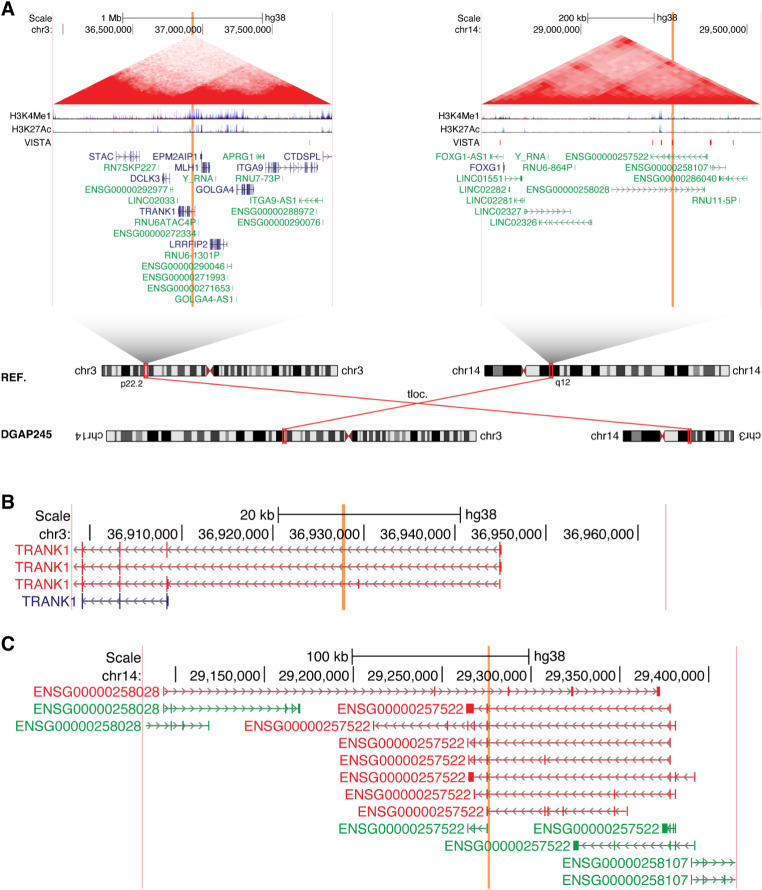
Fig. 4.
The lncRNA ENSG00000257522 is disrupted in multiple individuals with microcephaly, as shown here for DGAP245. (A) Chromosome diagrams depict the translocation between 3p22.2 and 14q12 in DGAP245. Above, large regions containing the breakpoints are shown, with the breakpoint positions indicated by vertical orange bars and the edges of the region shown in vertical pink bars. The region shown surrounding 14q12 is a TAD, with its borders previously defined in (Dixon et al. 2012). No TAD was defined surrounding 3p22.2, so instead the region including 1 Mb on either side of the breakpoints is displayed. Triangular contact maps display micro-C data indicating chromatin conformation (Krietenstein et al. 2020). H3K4Me1 and H3K27Ac tracks depict enhancer-associated chromatin modifications (ENCODE Project Consortium 2012). The VISTA track shows experimentally validated enhancer elements (Visel et al. 2007). Protein-coding genes are shown in blue and non-coding genes in green, with a single isoform depicted per gene (B) Expanded view of the genomic region surrounding the 3p22.2 breakpoints in DGAP245. (C) Expanded view of the genomic region surrounding the 14q12 breakpoints in DGAP245. The directly disrupted lncRNAs ENSG00000258028 and ENSG00000257522 are highlighted in red

