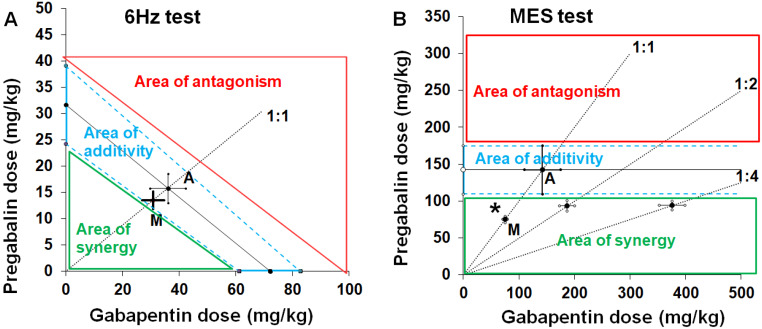
Fig. 2.
Isobolograms illustrating interactions between gabapentin and pregabalin in the 6 Hz corneal stimulation-induced seizure (A) and maximal electroshock-induced (MES) seizure (B) tests in mice. A. The type I isobolographic analysis was used to assess the interactions between two fully effective drugs in the mouse 6 Hz test (A). The isobologram for the combination of two fully active drugs, pregabalin and gabapentin in the 6 Hz test was presented earlier [77], and partly modified to display isobolographically areas of synergy, additivity and antagonism, where the experimentally derived ED50 mix value can be placed. The ED50 values for pregabalin and gabapentin when used alone in the 6 Hz test are placed on the ordinate (Y) and abscissa (X) of the Cartesian plot system of coordinates, respectively. The line connecting these ED50 values on the X and Y axes is the line of additivity. The diagonal line starting from the beginning of the Cartesian plot system and crossing the line of additivity indicates the proportion of the two-drug mixture (at the fixed-ratio of 1:1). For the interaction of pregabalin with gabapentin in the 6 Hz test, the experimentally derived ED50 mix (as the point M on the graph) is placed in the area of additivity, close to the point A, which reflects the theoretically calculated ED50 add value, predicted to exert additive interaction between drugs. B. The type II isobolographic analysis was conducted to evaluate the interaction between drugs of which gabapentin was ineffective in the mouse MES test (B). The isobologram for the combination of pregabalin (a fully active drug) and gabapentin (a virtually ineffective drug) in the MES test was presented earlier [130], and partly modified to display isobolographically areas of synergy, additivity and antagonism, where the experimentally derived ED50 mix value can be placed. The ED50 value for pregabalin when used alone in the mouse MES test is placed on the ordinate of the Cartesian plot system of coordinates. The line parallel to X axis starting from the ED50 for pregabalin is the line of indifference (additivity). The diagonal lines starting from the beginning of the Cartesian plot system and crossing the line of additivity indicate the proportions of the drugs in the mixture (at the fixed-ratios of 1:1, 1:2 and 1:4). For the interaction of pregabalin with gabapentin in the MES test, the experimentally derived ED50 mix (as the point M on the graph for the fixed-ratio of 1:1) is placed in the area of synergy, significantly below the area of additivity (*p < 0.05), which reflects the theoretically calculated ED50 add value, predicted to exert additive interaction between drugs

