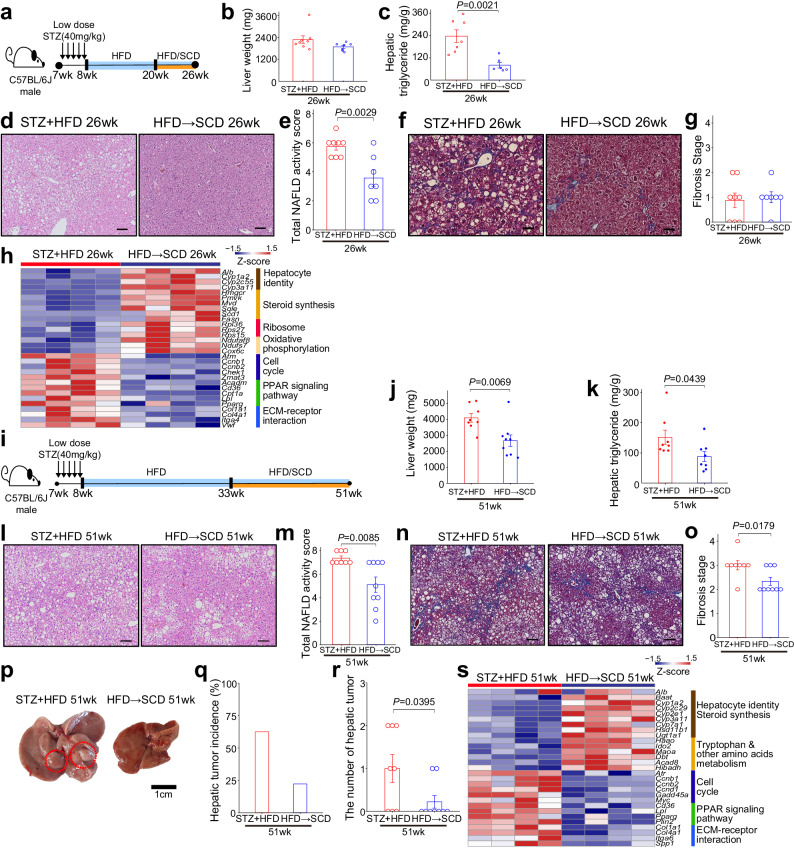
Fig. 4. Dietary changes ameliorate MASH, hepatic fibrosis, and hepatic tumorigenesis in STZ + HFD mice.
a–h Seven-week-old B6J mice were treated with STZ, fed HFD from 8 to 20 weeks, followed by HFD or SCD (HFD → SCD) until 26 weeks. a Schematic figure. b Liver weight; STZ + HFD, n = 8; HFD → SCD, n = 7. c Hepatic triglyceride levels; STZ + HFD, n = 7; HFD → SCD, n = 6. d Representative liver histology assessed via H&E staining (scale bar, 100 μm). e NAS grading using the NASH CRN scoring system; STZ + HFD, n = 8; HFD → SCD, n = 7. f Representative liver histology with Masson’s trichrome staining (scale bar, 100 μm). g Fibrosis stage grading with the NASH CRN scoring system; STZ + HFD, n = 8; HFD → SCD, n = 7. h Heatmap displaying the top differentially enriched pathways between two groups. i–s Seven-week-old B6J mice were treated with STZ and fed HFD from 8 to 33 weeks, followed by administration of HFD or SCD (HFD → SCD) until 51 weeks. i Schematic figure. j Liver weight; STZ + HFD, n = 8; HFD → SCD, n = 9. k Hepatic triglyceride levels; n = 8 per group. l Representative liver histology evaluation via H&E staining (Scale bar, 100 μm). m NAS grading based on the NASH CRN scoring system; STZ + HFD, n = 8; HFD → SCD, n = 9. n Representative liver histology via Masson’s trichrome staining (Scale bar, 100 μm). o Fibrosis stage grading via the NASH CRN scoring system; STZ + HFD, n = 8; HFD → SCD, n = 9. p Representative liver gross image (Scale bar, 1 cm). Red circles indicate hepatic tumors. Hepatic tumor (q) incidence and (r) number; STZ + HFD, n = 8; HFD → SCD, n = 9. s Heatmap displaying top differentially enriched pathways between two groups. Data are expressed as means ± SEM. *P < 0.05, **P < 0.01, ***P < 0.001, ****P < 0.0001, compared with age-matched group, two-sided Student’s t-test or Welch’s t-test (b, c, e, g, j, k, m, o, r). Source data are provided as a Source Data file.

