
Fig. 2.
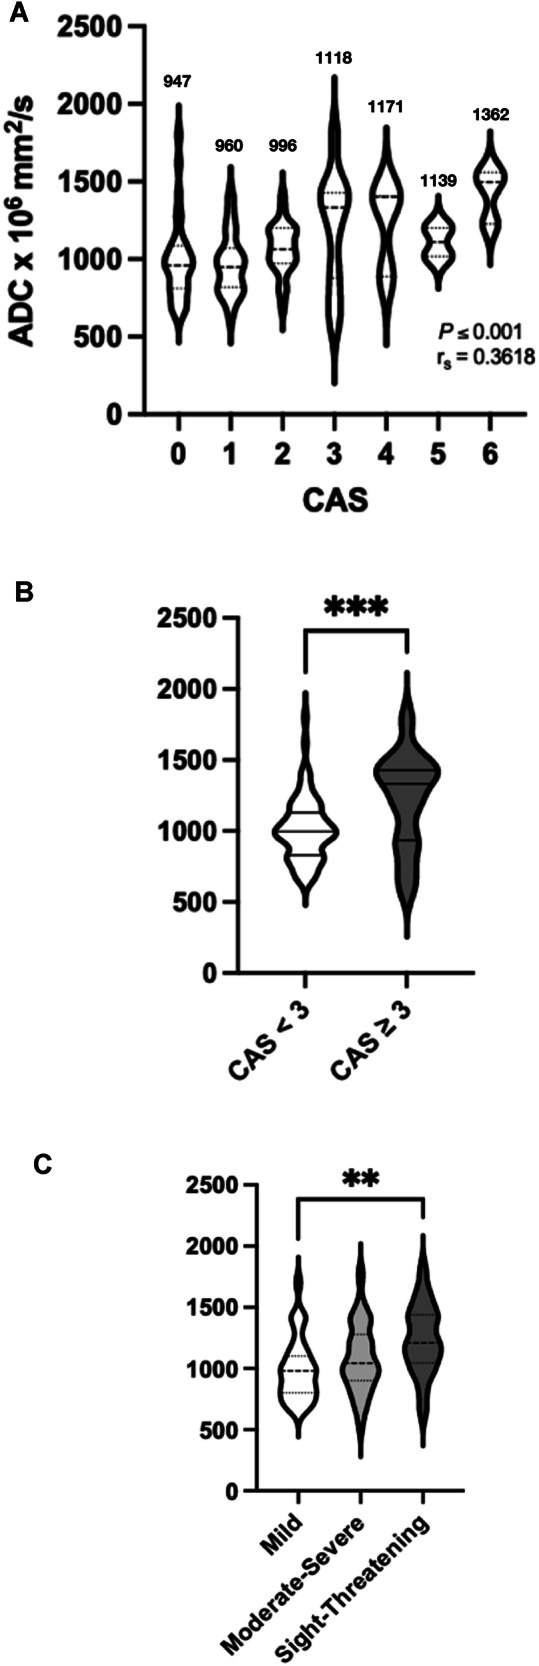
Correlation between CAS and EUGOGO Severity Scale, and ADC with a clinically meaningful group-wise comparison of ADC and CAS in the overall cohort. Violin plots demonstrate a positive Spearman rank correlation coefficient between CAS and ADC (n = 105) as well as the median value of each CAS score (in mm2/s) (A) and significantly greater ADC values in CAS ≥ 3 (n = 29) compared with CAS < 3 (n = 76) groups (B) (***p ≤ 0.001, 2-tailed). Greater ADC values in the sight-threatening severity cohort compared with those in the mild severity cohort (**p ≤ 0.01, 2-tailed) with no significant difference between the other groups (C)