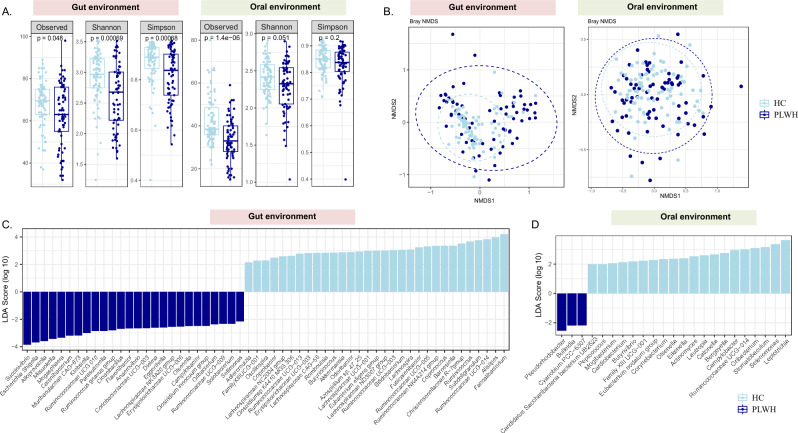
Figure 1.
Alpha diversity and compositional changes in the gut and oral microbiome between Healthy Controls (HC, n = 80) and People living with HIV (PLWH, n = 69). (A) Boxplots showing the differences in the alpha diversity indices within the HC and PLWH in the gut and oral environment (B) NMDS plot illustrating the changes of beta diversity within the HC and PLWH in the gut and oral environment. Linear discriminant analysis effect size (LEfSe) analysis at the genus level showing the differentially abundant microbiota between HC and PLWH in the (C) gut and (D) oral samples, respectively.

