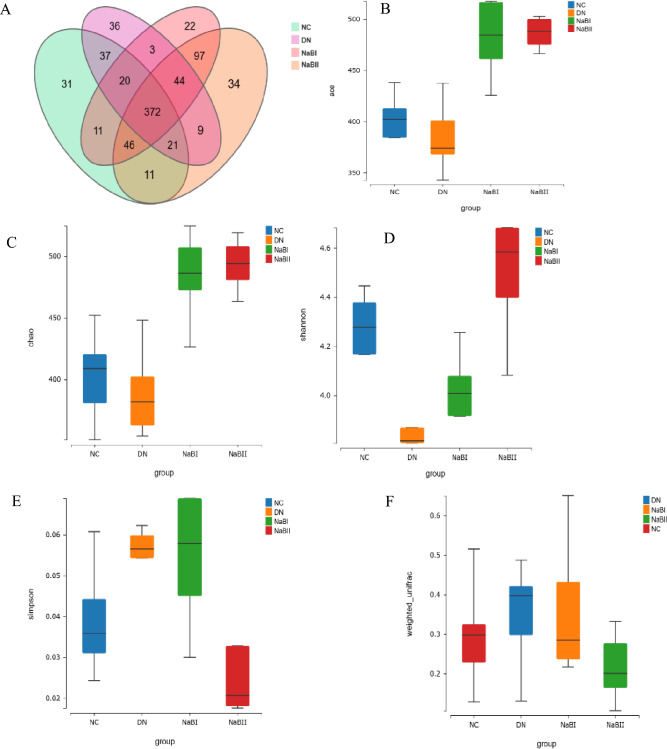
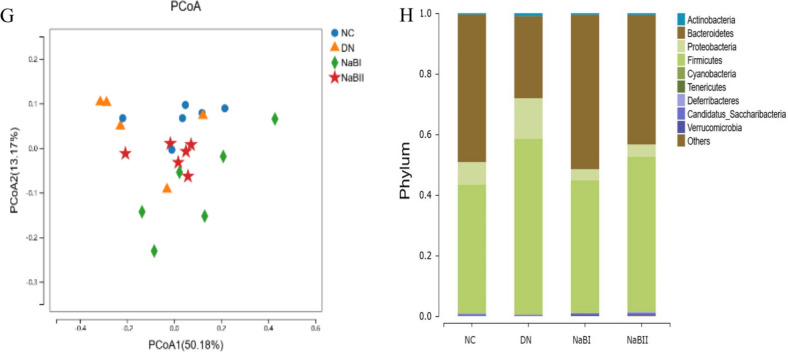
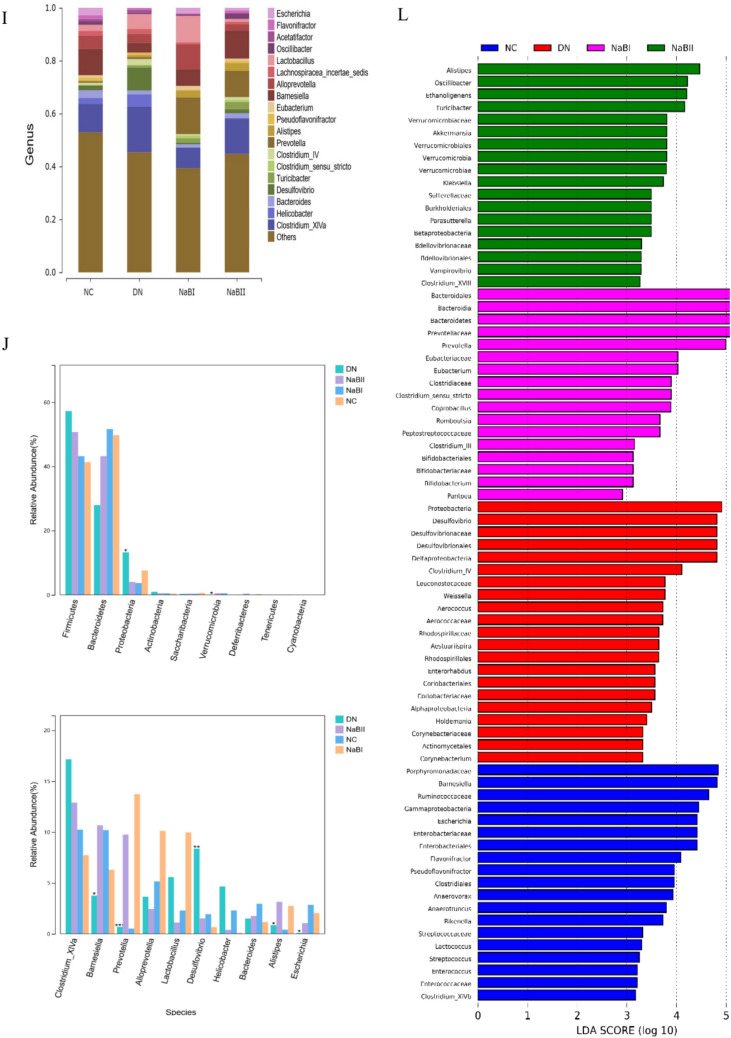
Figure 8.
The fecal microbial α-diversity and differentially abundant taxa in four groups. (A) α diversity of fecal intestinal flora in four groups. (B) The fecal microbial richness calculated by ACE among four groups. (C) The fecal microbial richness calculated by Chao among four groups. (D) The fecal microbial richness calculated by Shannon among four groups. (E) The fecal microbial uniformity calculated by Simpson among four groups. (F) Four groups of fecal microorganisms β diversity box diagram. (G) Fecal microbial β diversity calculated by principal coordinate analysis among four groups. (H) Histogram of species composition at the phylum level. (I) Histogram of species composition at the genus level. (J) Analysis of bacteria groups with significant difference at phylum level. (K) Analysis of significantly different flora at genus level. (L) LDA effect size among four groups.


