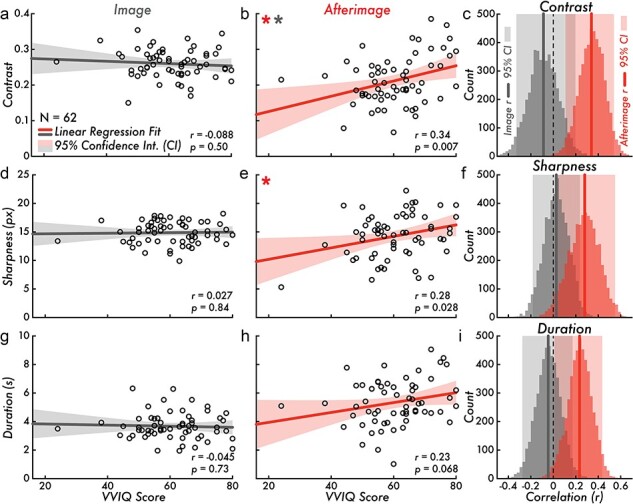
Figure 3.

VVIQ score versus image and afterimage contrast, sharpness, and duration. (a) VVIQ score versus image contrast (correlation is not statistically significant; Pearson correlation coefficient [r] = −0.088, P = 0.50). (b) VVIQ score versus afterimage contrast (correlation is statistically significant red *; r = 0.34, P = 0.007). The VVIQ score versus afterimage contrast regression fit slope is significantly different from the VVIQ score versus image contrast regression fit slope (a; gray *; F[1, 120] = 7.45, P = 0.0073). (c) Bootstrapped image and afterimage VVIQ score and contrast correlation distributions and estimated 95% CI [image: (−0.33, 0.20); afterimage: (0.11, 0.54)]. (d) VVIQ score versus image sharpness (correlation is not statistically significant; r = 0.027, P = 0.84). (e) VVIQ score versus afterimage sharpness (correlation is statistically significant *; r = 0.28, P= 0.028). (f) Bootstrapped image and afterimage VVIQ score and sharpness correlation distributions and estimated 95% CI [image: (−0.18, 0.24); afterimage: (0.041, 0.55)]. (g) VVIQ score versus image duration (correlation is not statistically significant; r = −0.045, P = 0.73). (h) VVIQ score versus afterimage duration (correlation is not statistically significant; r = 0.23, P = 0.068). (i) Bootstrapped image and afterimage VVIQ score and duration correlation distributions and estimated 95% CI [image: (−0.28, 0.17); afterimage: (0.01, 0.44)]. Subplots a, b, d, e, g, and h, display the VVIQ score along the horizontal axis (score range: 16–80; larger values indicating more vivid visual imagery). The gray and red lines draw the linear regression fit of VVIQ score versus image or afterimage contrast, sharpness, and duration. The shaded area on either side of the main trend line is the 95% CI of the linear regression fit. The open circles represent individual participants (N = 62). In subplots c, f, and i, the gray and red vertical lines draw the Pearson correlation coefficient r value of the VVIQ score versus image or afterimage contrast, sharpness, and duration. The shaded area behind the bootstrap correlation distributions is the estimated 95% CI
