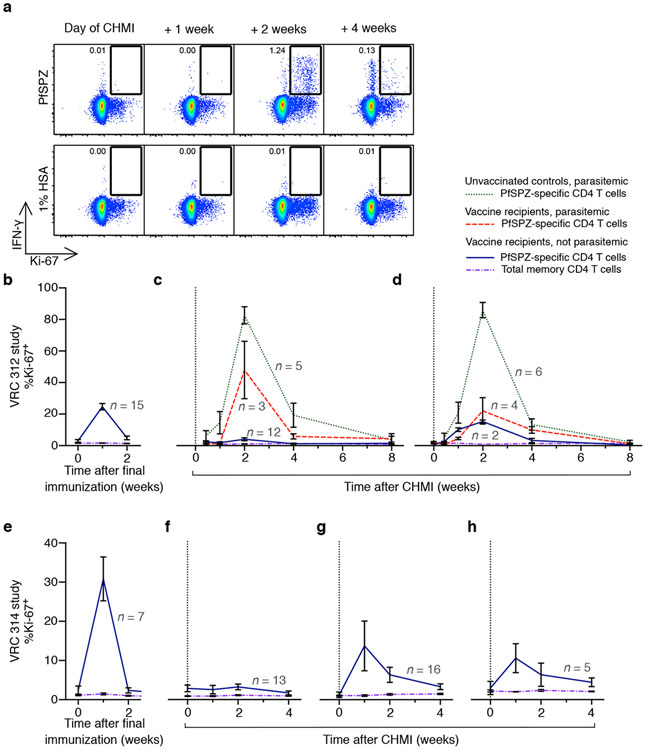
Figure 5. Activation of PfSPZ-specific CD4 T cells following CHMI.
PBMCs were isolated before and after the final vaccination and each CHMI from vaccinated subjects and unvaccinated controls in the VRC 312 and VRC 314 studies. Cells were incubated with PfSPZ or vaccine diluent (1% HSA), and IFN-γ, IL-2, TNF-α, and Ki-67 expression were assessed by flow cytometry.
(a) Gating example showing memory CD4 T cells at 0, 1, 2, and 4 weeks following CHMI in an unvaccinated control who developed parasitemia. PfSPZ-specific cells are identified by expression of IFN-γ following PfSPZ stimulation, and cells undergoing replication are identified by Ki-67.
(b) Percentage of either total memory CD4 T cells (purple, dot-dash) expressing Ki-67 or PfSPZ-specific CD4 T cells (blue, solid) expressing Ki-67 after final immunization in vaccine recipients who received 1.35 × 10⁵ PfSPZ IV in the VRC 312 study.
(c–d) Frequency of cells (see key) expressing Ki-67 in vaccine recipients who did or did not develop parasitemia following CHMI at 3 (c) and 21 (d) weeks after final vaccination. Unvaccinated controls are also shown. Subjects were from the VRC 312 study.
(e) Same analysis as in b, for IV-vaccinated subjects in the VRC 314 study.
(f–h) Same analysis as in c–d, except subjects are IV-vaccinated subjects from the VRC 314 study, and CHMIs occurred 3 (f), 21–25 (g), and 59 (h) weeks after final vaccination.
For b–h, PfSPZ-specific cells are identified by any combination of IFN-γ, IL-2, or TNF-α. Data are mean ± s.e.m. Gray numbers on graph denote number of subjects in each group.

