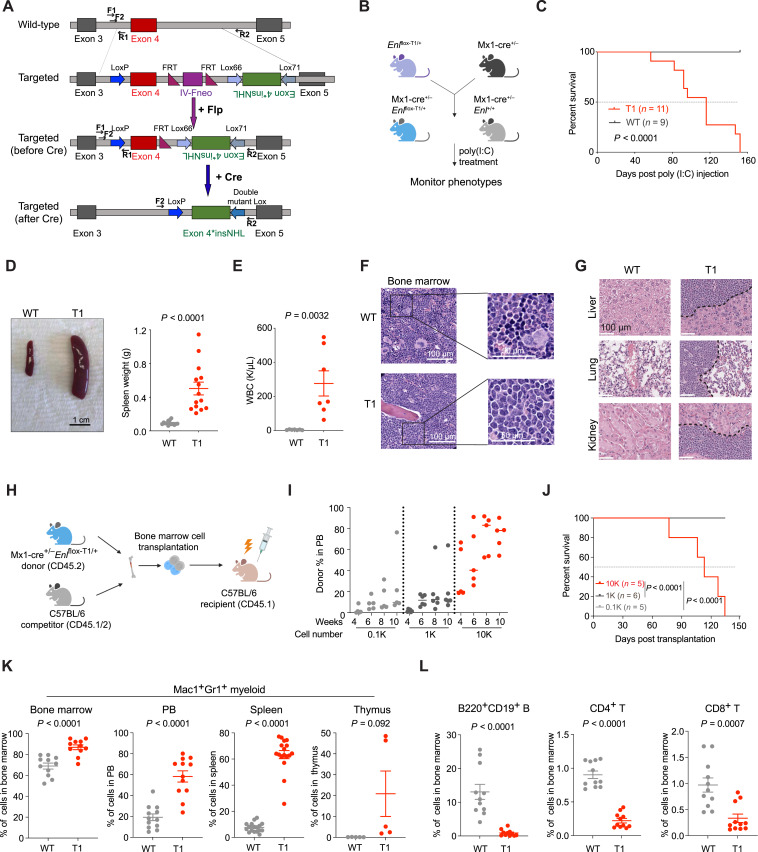
Figure 1.
Heterozygous Enl-T1 mutation drives aggressive AML in mice. A, Schematic design of a conditional knock-in mouse model for Enl-T1. Two pairs of primers (F1/R1 and F2/R2) used for genotyping shown in Supplementary Fig. S1 are depicted as black lines with arrowheads; Flp, flippase; FRT, flippase recombinase target; Lox66, Lox71, engineered recombination target sites derived from the WT loxP site. B, Breeding strategies to obtain Mx1-cre/Enlflox-T1/+ mice for experiments. poly (I:C), polyinosinic:polycytidylic acid. C, Kaplan–Meier survival curves of Enl-WT (n = 9) or Enl-T1 (n = 11) mice. Enl-WT, Mx1-cre/Enl+/+; Enl-T1, Mx1-cre/Enlflox-T1/+. P value using log-rank test. D, Representative images (left) and weight quantification (right) of spleen harvested from Enl-WT or T1 mice. Scale bar, 1 cm; bars represent the median (n = 14). P value using unpaired, two-tailed Student t test. E, WBC count of PB samples harvested from Enl-WT or T1 mice. Bars represent the median (n = 7). P value using unpaired, two-tailed Student t test. F, Representative hematoxylin and eosin (H&E) staining of BM harvested from Enl-WT or T1 mice. Scale bar, 100 μm (left, zoomed out); 50 μm (right, zoomed in). G, Representative H&E staining of liver (top), lung (middle), kidney (bottom) harvested from Enl-WT or T1 mice. Scale bar, 100 μm. H, BM transplantation experiment workflow. I, Flow cytometric quantification of Enl-T1 BM cells (CD45.2+CD45.1−) in the PB harvested at indicated time points from C57BL/6 recipient mice. Bars represent the median (0.1K, n = 5; 1K, n = 6; 10K, n = 5). J, Kaplan–Meier survival curves of C57BL/6 recipient mice that received 0.1K, 1K, 10K Enl-T1 BM cells. 0.1K, n = 5; 1K, n = 6; 10K, n = 5. P value using Log-rank test. K, Percentage of Mac1+Gr1+ myeloid cell population in the BM, PB, spleen, and thymus samples harvested from Enl-WT or T1 mice. Bars represent the median (BM, n = 11; PB, n = 12; spleen, n = 17; thymus, n = 5). P value using unpaired, two-tailed Student t test. L, Percentage of B220+CD19+ B, CD4+ T, and CD8+ T cells in BM samples harvested from Enl-WT or T1 mice. Bars represent the median (n = 11). P value using unpaired, two-tailed Student t test.

