Figure 2.
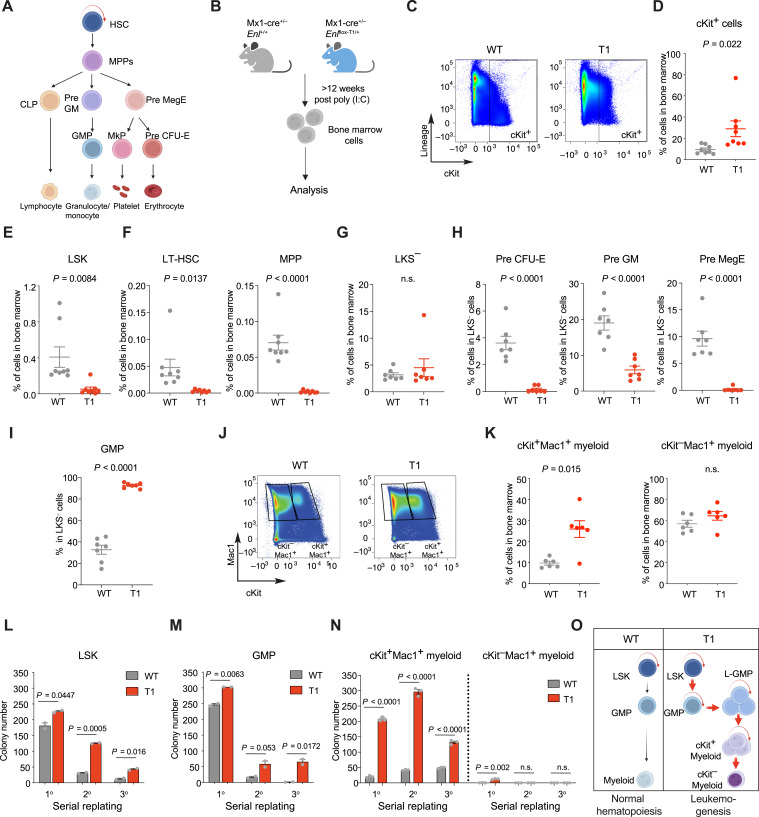
Enl mutation perturbs the normal hematopoietic hierarchy and leads to abnormal expansion of myeloid progenitors with increased self-renewal properties. A, Schematic representation of hematopoietic development from HSCs to differentiated blood cells. B, Schematic workflow of flow cytometric analysis for BM cells harvested from Enl-T1 leukemia mice and age-matched control mice (data shown in C–K). C and D, Representative flow cytometric plots (C) and the percentage (D) of cKit+ cells in BM samples. n = 8. E and F, Percentage of LSK (E), LT-HSC (F, left), and MPP (F, right) populations in BM. n = 8. G, Percentage of LKS− population in BM samples. n = 7. H and I, Percentage of Pre CFU-E (H, left), Pre GM (H, middle), Pre MegE (H, right), and GMP (I) cells in LKS− population from BM samples. n = 7. J and K, Representative flow cytometric gating plots (J) and the percentage (K) of cKit+Mac1+ (left) and cKit−Mac1+ (right) cells in BM. n = 6. L–N, Quantification of colonies formed by Enl-WT or T1 LSK (L), GMP (M), cKit+Mac1+ (N) and cKit−Mac1+ (N) cells. Error bars represent mean ± SEM (LSK, n = 2; GMP, n = 2; cKit+Mac1+, n = 3; cKit−Mac1+, n = 3). P values using unpaired, two-tailed Student t test. O, Schematic depicting how the Enl mutation perturbs the normal hematopoietic hierarchy and leads to the abnormal expansion of myeloid progenitors with increased self-renewal properties. D–I, K, Bars represent the median; P values using unpaired, two-tailed Student t test. n.s., not significant.

