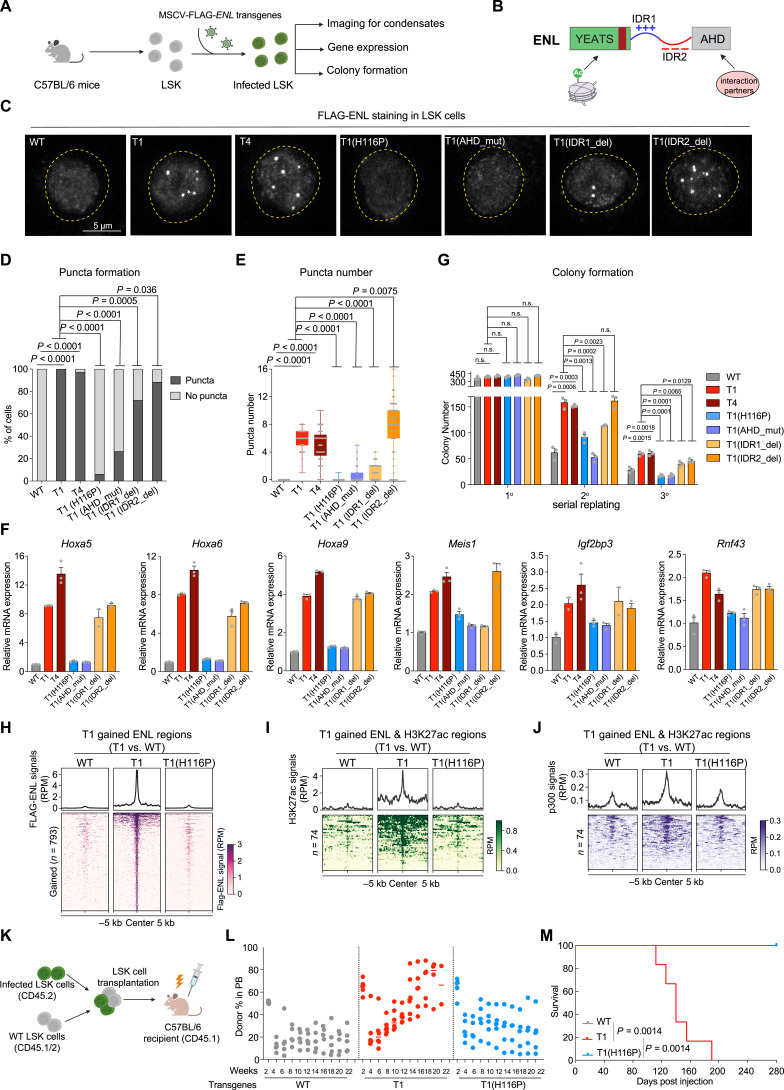
Figure 5.
Mutant ENL forms condensates at key target genes, and disrupting condensate formation impairs its oncogenic activity in HSPCs. A, Schematic representation of the transduction of various FLAG-tagged ENL transgenes in LSK cells and subsequent experiments (shown in C–G). B, Schematic depiction of domain structure and features of the ENL mutant protein. C, Representative images of anti-FLAG IF staining in LSK cells expressing the indicated FLAG-ENL transgenes. WT, ENL-WT; T1, ENL-T1; T4, ENL-T4; T1(H116P), H116P mutation in the YEATS domain of ENL-T1; T1(AHD_mut), DRD538RFR mutations in the AHD domain of ENL-T1; T1(IDR1_del), deletion of IDR1 in ENL-T1; T1(IDR2_del), deletion of IDR2 in ENL-T1. D and E, Percentage of nuclei with or without FLAG-ENL puncta (D) and the number of FLAG-ENL puncta (E) in each nucleus in LSK cells. Error bars represent mean ± SEM. P values using unpaired, two-tailed Student t test. F, RT-qPCR analysis showing mRNA expression of Hoxa5/6/9, Meis1, Igf2bp3, and Rnf43 in LSK cells expressing indicated FLAG-ENL transgenes. Error bars represent mean ± SEM (n = 3). G, Quantification of colonies formed by LSK cells expressing indicated FLAG-ENL transgenes. Error bars represent mean ± SEM (n = 3). P value using unpaired, two-tailed Student t test. H, Average occupancies (top) and heatmap (bottom) representation of FLAG-ENL-bound peak regions that show increased occupancy by T1 compared with WT ENL in LSK cells expressing the indicated FLAG-ENL transgenes. The CUT&Tag signals are normalized by reads per million (RPM). See Supplementary Table S32. I and J, Average occupancies (top) and heatmap (bottom) showing H3K27ac (I) and p300 (J) at genomic regions that exhibit T1-induced increase in H3K27ac and FLAG-ENL in LSK cells expressing the indicated FLAG-ENL transgenes. The CUT&Tag or ChIP-seq signal are normalized by RPM. See Supplementary Table S33. K, Schematic workflow of LSK cells transplantation experiment. L, Flow cytometric quantification of FLAG-ENL transgenes expressing cells (CD45.2+CD45.1−) in the PB harvested at indicated time points from C57BL/6 recipient mice. Bars represent the median (WT, n = 5; T1, n = 6; T1(H116P), n = 5). P value using unpaired, two-tailed Student t test. M, Kaplan–Meier survival curves of C57BL/6 recipient mice that received LSK cells expressing the indicated FLAG-ENL transgenes. WT, n = 5; T1, n = 6; T1(H116P), n = 5. The gray line (WT) overlapped with the blue line [T1 (H116P)]. P value using log-rank test.

