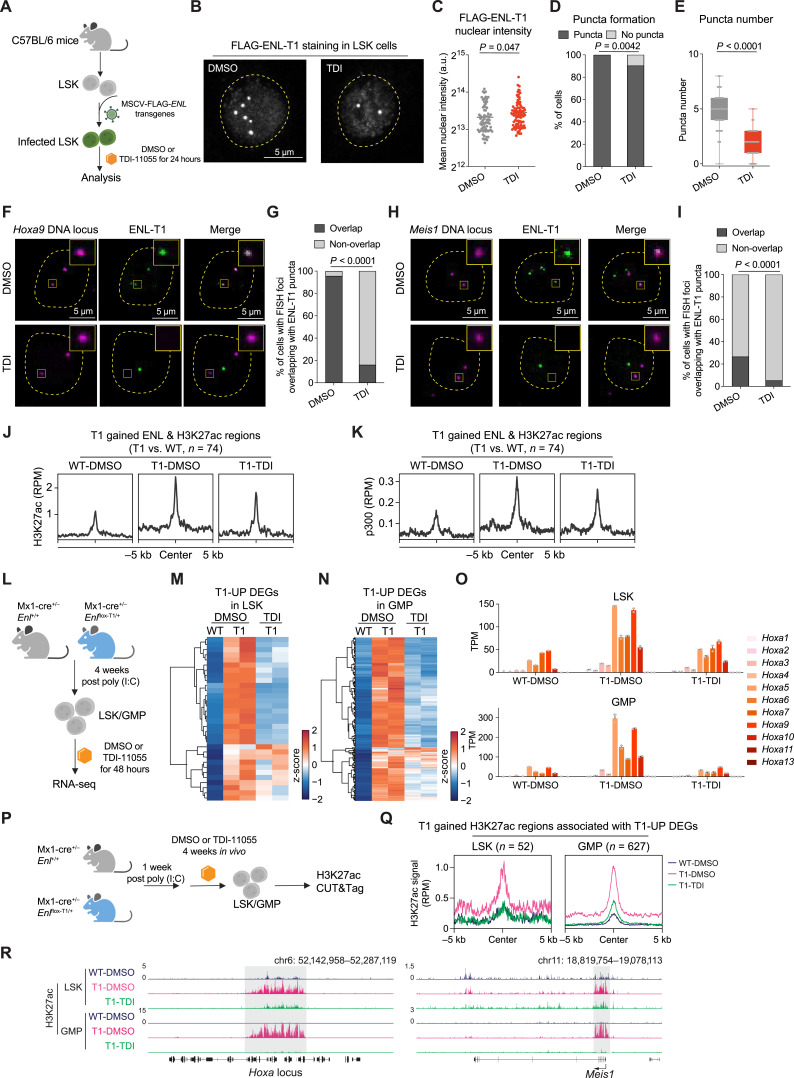
Figure 6.
Small-molecule inhibition of the acetyl-binding activity of mutant ENL displaces its condensates from target loci and impairs its chromatin function in HSPCs. A, Schematic representation of LSK cells expressing FLAG-ENL-T1 transgene under DMSO or 10 µmol/L TDI-11055 (TDI for short) treatment for 24 hours and subsequent experiments (shown in A–K). B, Representative images of anti-FLAG IF staining in LSK cells treated with DMSO or TDI-11055. C–E, Nuclear intensity (C), percentage of nuclei with or without FLAG-ENL puncta (D), and the number of FLAG-ENL puncta (E) in each nucleus in LSK cells treated with DMSO or TDI-11055 (TDI). Error bars represent mean ± SEM. P values using unpaired, two-tailed Student t test. F and G, Representative images (F) and quantification (G) showing percentage of DMSO or TDI-11055 treated cells containing at least one Hoxa9 DNA locus overlapping with an ENL-T1 puncta. DMSO, n = 89; TDI-11055, n = 75. P value using unpaired, two-tailed Student t test. H and I, Representative images (H) and quantification (I) showing percentage of DMSO or TDI-11055 treated cells containing at least one Meis1 DNA locus overlapping with an ENL-T1 puncta. DMSO, n = 79; TDI-11055, n = 76. P value using unpaired, two-tailed Student t test. J and K, Average occupancies of H3K27ac (J) and p300 (K) at genomic regions that exhibit T1-induced increase in FLAG-ENL and H3K27ac occupancies in LSK cells expressing FLAG-ENL-T1 transgenes under DMSO or TDI-11055 treatment. The CUT&Tag or ChIP-seq signals are normalized by RPM. See Supplementary Table S33. L, Schematic showing ex vivo treatment of LSK/GMP cells sorted from Enl-WT or T1 mice and following RNA-seq analysis (shown in M–O). M and N, Heatmap showing gene expression of T1-UP DEGs (identified in Supplementary Fig. S23A and S23B) in LSK (M) and GMP (N) treated with DMSO or TDI-11055. Gene expression is scaled by z-score. See Supplementary Tables S34 and S35. O, Bar plots showing the gene expression of Hoxa genes in WT or T1 LSK (top) and GMP (bottom) treated with DMSO or TDI-11055. Gene expression is obtained from the RNA-seq data and normalized by TPM. Dots represent different biological replicates. Bars represent the median. See Supplementary Table S36. P, Schematic showing in vivo treatment of Enl-WT or T1 mice and subsequent H3K27ac profiling in LSK/GMP cells. Q, Average occupancy of H3K27ac on T1-induced H3K27ac DRs that are associated with T1-UP DEGs in LSK (left) and GMP (right) treated with DMSO or TDI-11055. See Supplementary Table S17. R, Genome browser view of H3K27ac CUT&Tag signals at select genes under indicated treatment conditions in LSK and GMP.

