. 2024 May 22;6(4):e230218. doi: 10.1148/ryai.230218

Figure 4:

Chart of the top 20 relevant features with their importance scores measured by Shapley additive explanations (SHAP) values. The feature names are labeled as region of interest 1 (ROI1) and ROI2, representing the whole tumor and the nonenhancing tumor (NET), necrosis (NCR), and edema (ED) region of interests, respectively. glcm = gray-level co-occurrence matrix, glszm = gray-level size zone matrix, log = Laplacian of Gaussian, ROI = region of interest, wavelet-LH = wavelet filtering with low-pass and high-pass filters, wavelet-LL = wavelet filtering with low-pass filters.

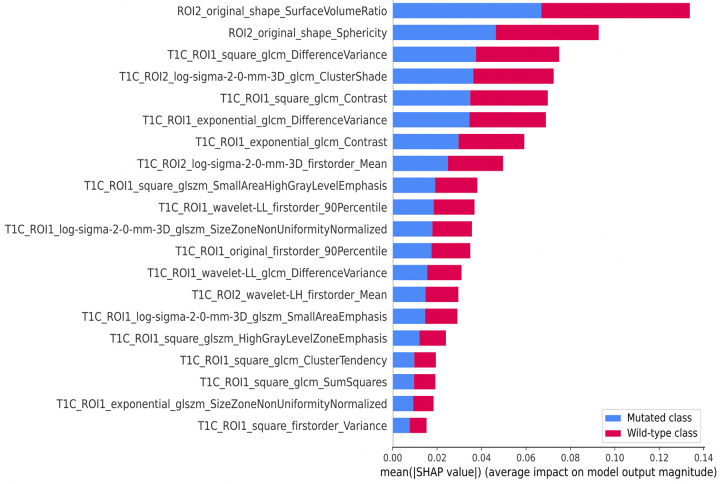
Chart of the top 20 relevant features with their importance scores measured by Shapley additive explanations (SHAP) values. The feature names are labeled as region of interest 1 (ROI1) and ROI2, representing the whole tumor and the nonenhancing tumor (NET), necrosis (NCR), and edema (ED) region of interests, respectively. glcm = gray-level co-occurrence matrix, glszm = gray-level size zone matrix, log = Laplacian of Gaussian, ROI = region of interest, wavelet-LH = wavelet filtering with low-pass and high-pass filters, wavelet-LL = wavelet filtering with low-pass filters.