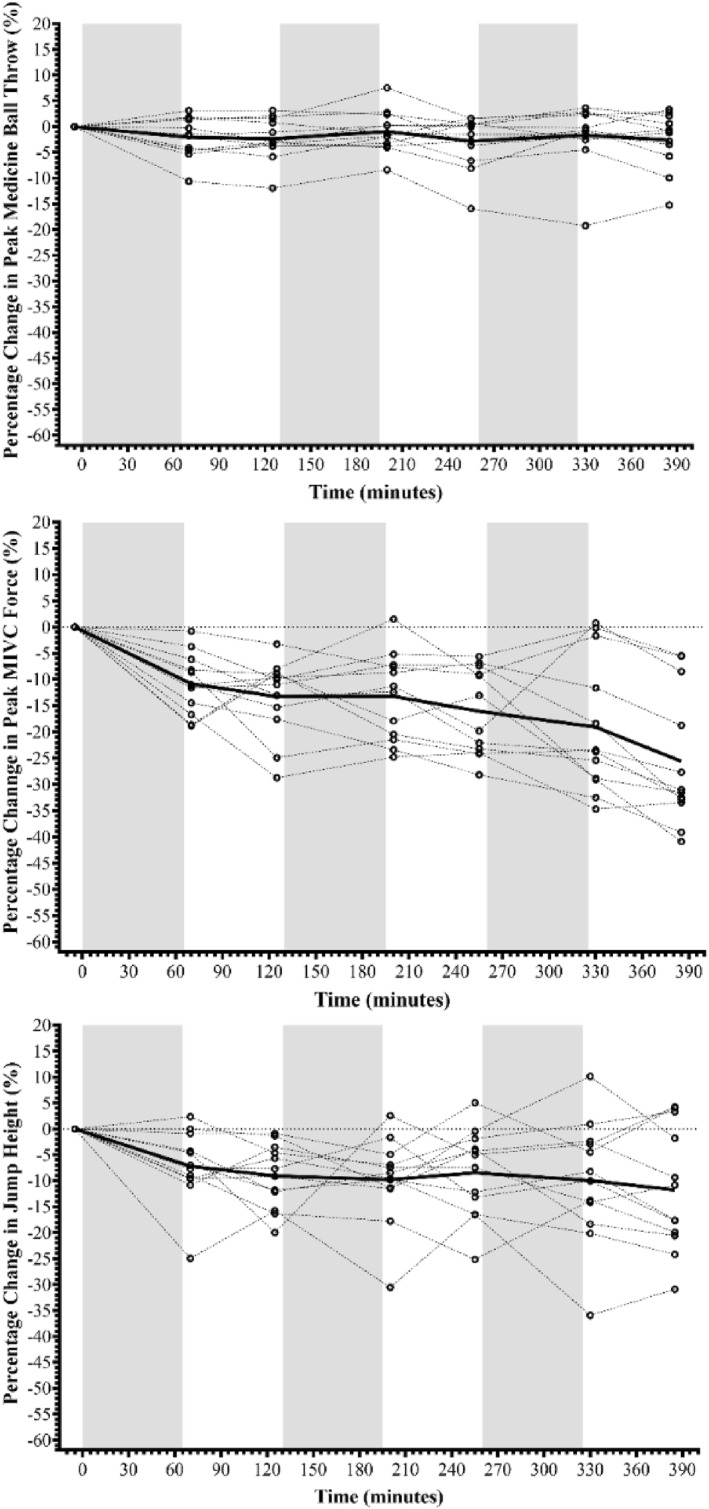
FIGURE 3.

The percentage change in medicine ball throw distance, peak maximal isometric force of the quadriceps and weighted countermovement jump height across the three Fast Load Carriage Protocol bouts. Where black circles (o) denote individual data points with dotted lines connecting these across assessment points; thick black line (−) denotes the group mean average across assessment points and greyed areas denote each of the three fast load carriage protocols completed.
