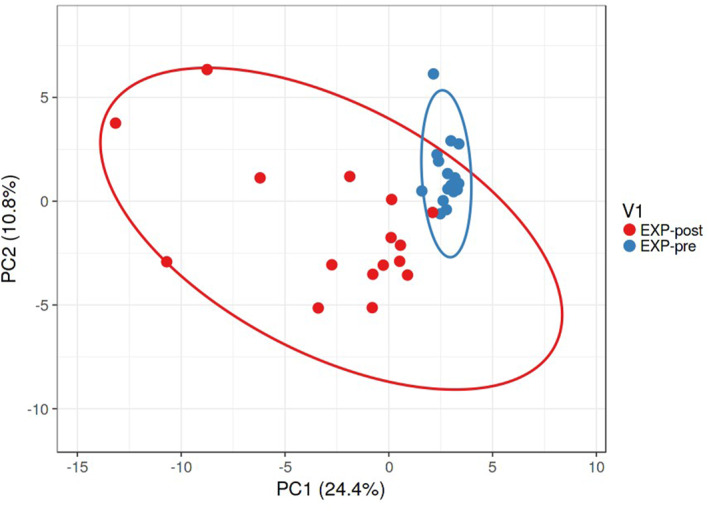
FIGURE 3.

Beta‐diversity of the composition of the gut microbiota for MS patients at baseline and after an intervention, as visualized by PCA. Beta‐diversity of the composition of gut microbiota at the species level is represented by significantly altered bacterial taxa (p < 0.05) in EXP, as visualized by PCA. SVD with imputation is used to calculate the principal components. The X and Y axes show principal components 1 and 2, which explain 24.4% and 10.8% of the total variance, respectively. Prediction ellipses are such that, with a probability of 0.95, a new observation from the same group will fall inside the ellipse. N = 16 data points. EXP, experimental group.
