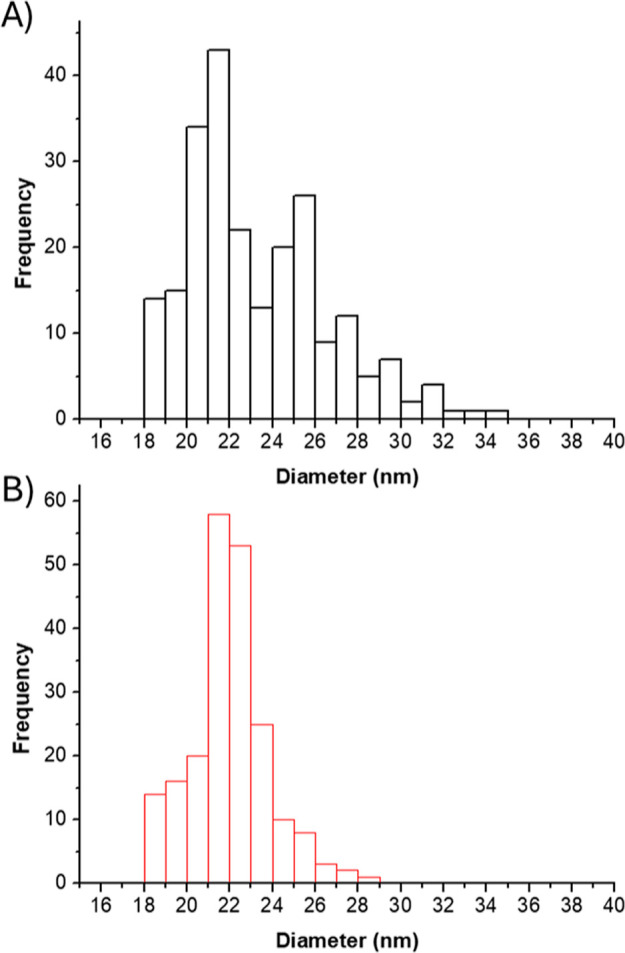
Figure 1.

Histograms showing the diameters distribution of the gold nanoparticles analyzed by SP-ICP-MS. (A) (in black) Unconjugated nanoparticles and (B) (in red) nanoparticles after being conjugated with the oligonucleotide probe, with a shift to higher diameter values.
