
Figure 3.
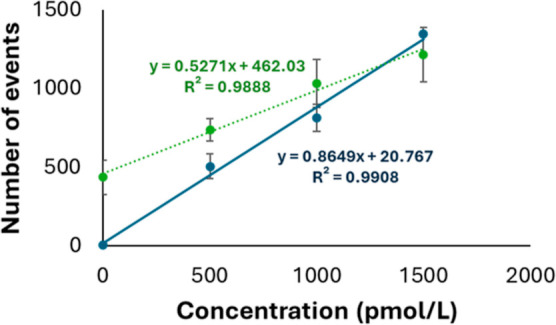
Calibration graphs used for the calculation of the relationship between the number of detected gold events using water (orange dotted line) and blood serum (blue solid line) as a matrix. Equations and correlation coefficients are shown next to and in the same color as the corresponding regression line. Error bars show the standard deviation of three replicates for each concentration level.