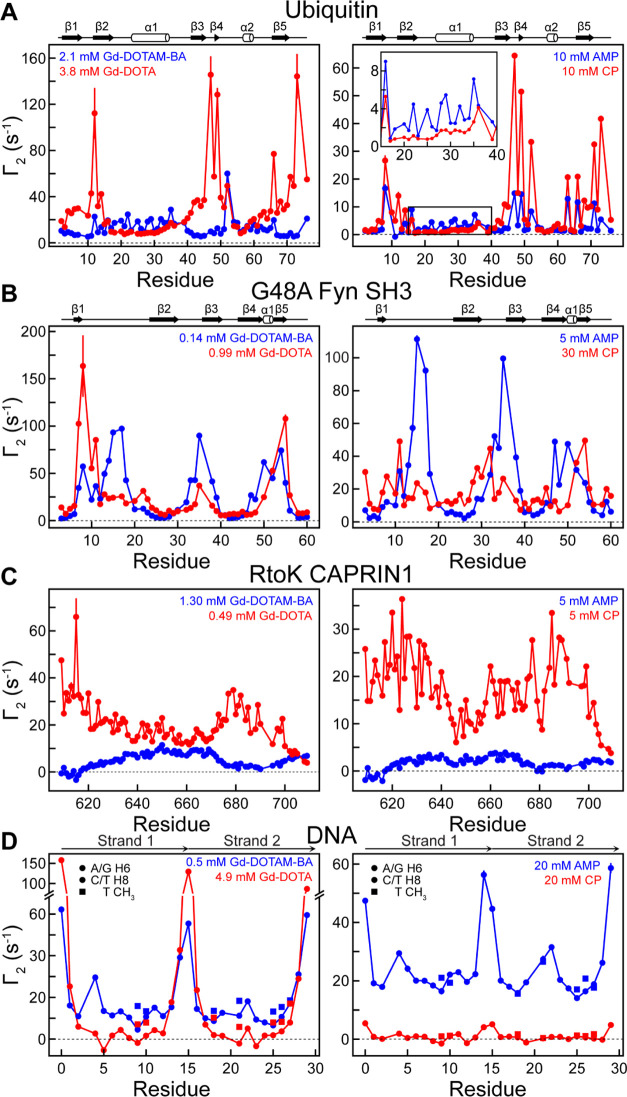
Figure 4.
Transverse 1H PRE rates measured with Gd-DOTA (−1e) and Gd-DOTAM-BA (+1e) (left-hand side) or with carboxy-PROXYL (CP; −1e) and aminomethyl-PROXYL (AMP; +1e) (right-hand side) cosolute pairs. The concentrations of the paramagnetic cosolutes used are indicated. (A) Backbone 1HN Γ2 data for 0.3 mM 15N-labeled ubiquitin in a buffer of 20 mM Tris·acetate (pH 7.5) and 5% D2O at 25 °C. (B) Backbone 1HN Γ2 data for 0.14 mM 2H,15N-labeled G48A Fyn SH3 in 20 mM sodium phosphate (pH 6.0), 5% D2O at 10 °C. (C) Backbone 1HN Γ2 data for 15N-labeled RtoK CAPRIN1 dissolved in 25 mM MES (pH 5.5), 5% D2O. (D) Γ2 data for 0.3 mM 13C,15N-labeled 15-bp DNA in a buffer of 10 mM potassium phosphate (pH 7.4), 100 mM NaCl, and 5% D2O at 25 °C. The negative Γ2 values observed for H6/H8 of G5, T21, and G23 could be due to pulse imperfections44 as their C6/C8 resonances were near the edge of the bandwidth of the 13C Q3 selective pulses used. Secondary structure diagrams are shown above the profiles for ubiquitin and G48A Fyn SH3.

