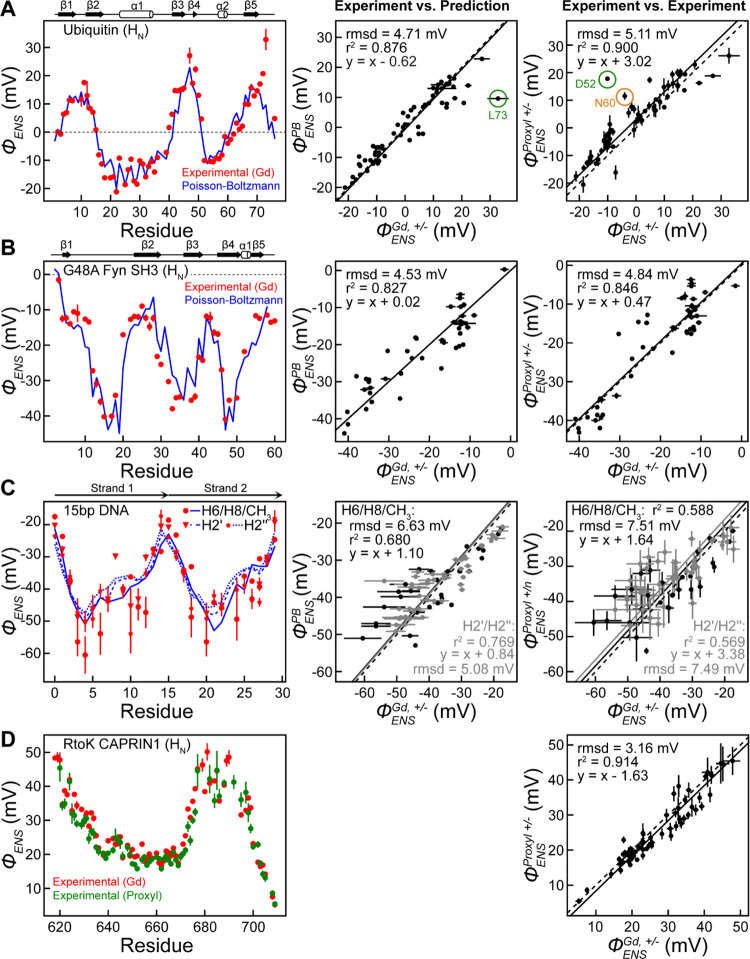
Figure 5.
Comparison of measured and calculated electrostatic potentials for a range of biomolecular systems. ϕENS potentials measured using Gd-DOTA (−1e) and Gd-DOTAM-BA (+1e) are shown in red for (A) ubiquitin, (B) G48A Fyn SH3, (C) 15-bp DNA, and (D) RtoK CAPRIN1. ϕENS values were determined from the solvent PRE data shown in Figure 4 using eq 2. In (A–C), the measured ϕENS potentials are compared with potentials obtained via Poisson–Boltzmann calculations (ϕPBENS), which are shown in blue, and the middle panels show correlations between the experimental (ϕGdENS) and predicted (ϕPBENS) potentials. The right panels show correlations between the experimental potentials measured with the Gd chelates and those measured with PROXYL derivatives. In (A, B, D), ϕProxylENS values were measured using amino-methyl-PROXYL (+1e) and carboxy-PROXYL (−1e) cosolutes, while in (C), ϕProxyl+/nENS values were measured using aminomethyl-PROXYL (+1e) and carbamoyl-PROXYL (neutral) cosolutes. In (D), ϕENS potentials measured using carboxy-PROXYL (−1e) and aminomethyl-PROXYL (+1e) are shown in green, and a correlation plot for the two experimental datasets (Gd- and PROXYL-based) is shown. In each correlation plot, the dotted line is the diagonal (i.e., y = x), whereas the solid line, y = x + a, is based on linear regression. Outlier ϕENS values (residues D52, N60, L73) are circled in (A) and discussed in the text. D52 and N60 were excluded in the calculation of RMSD between ϕGdENS and ϕProxylENS. See text and SI for discussion. Error bars were obtained using eq 4. In (C), errors in ϕENS potentials for CH3 groups are far smaller than those for other DNA 1H nuclei.

