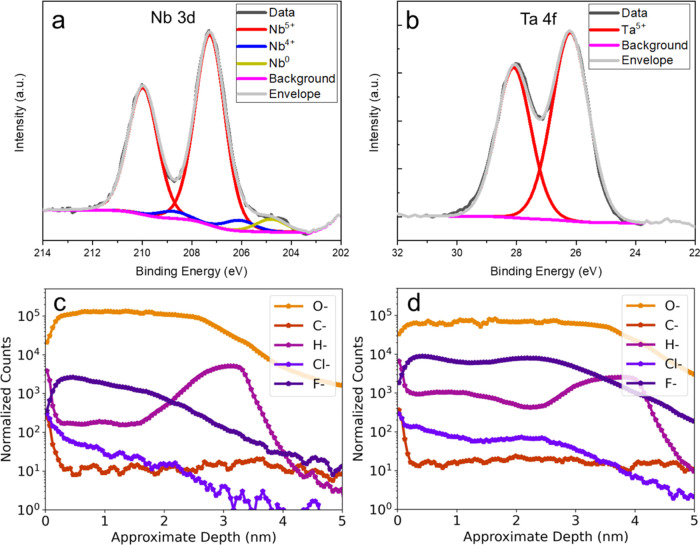
Figure 4.
XPS and ToF-SIMS characterization. a, Nb 3d intensity consists of Nb2O5, NbO2, and Nb (only Nb(0) 3d 3/2 is shown). b, Ta 4f intensity only consists of Ta2O5. Black, violet, and gray lines represent the raw spectrum, background, and envelope, respectively. Normalized ToF-SIMS depth profiles showing O–, C–, H–, Cl–, and F– of c, bare Nb, and d, Ta-capped Nb thin films.

