Figure 5.

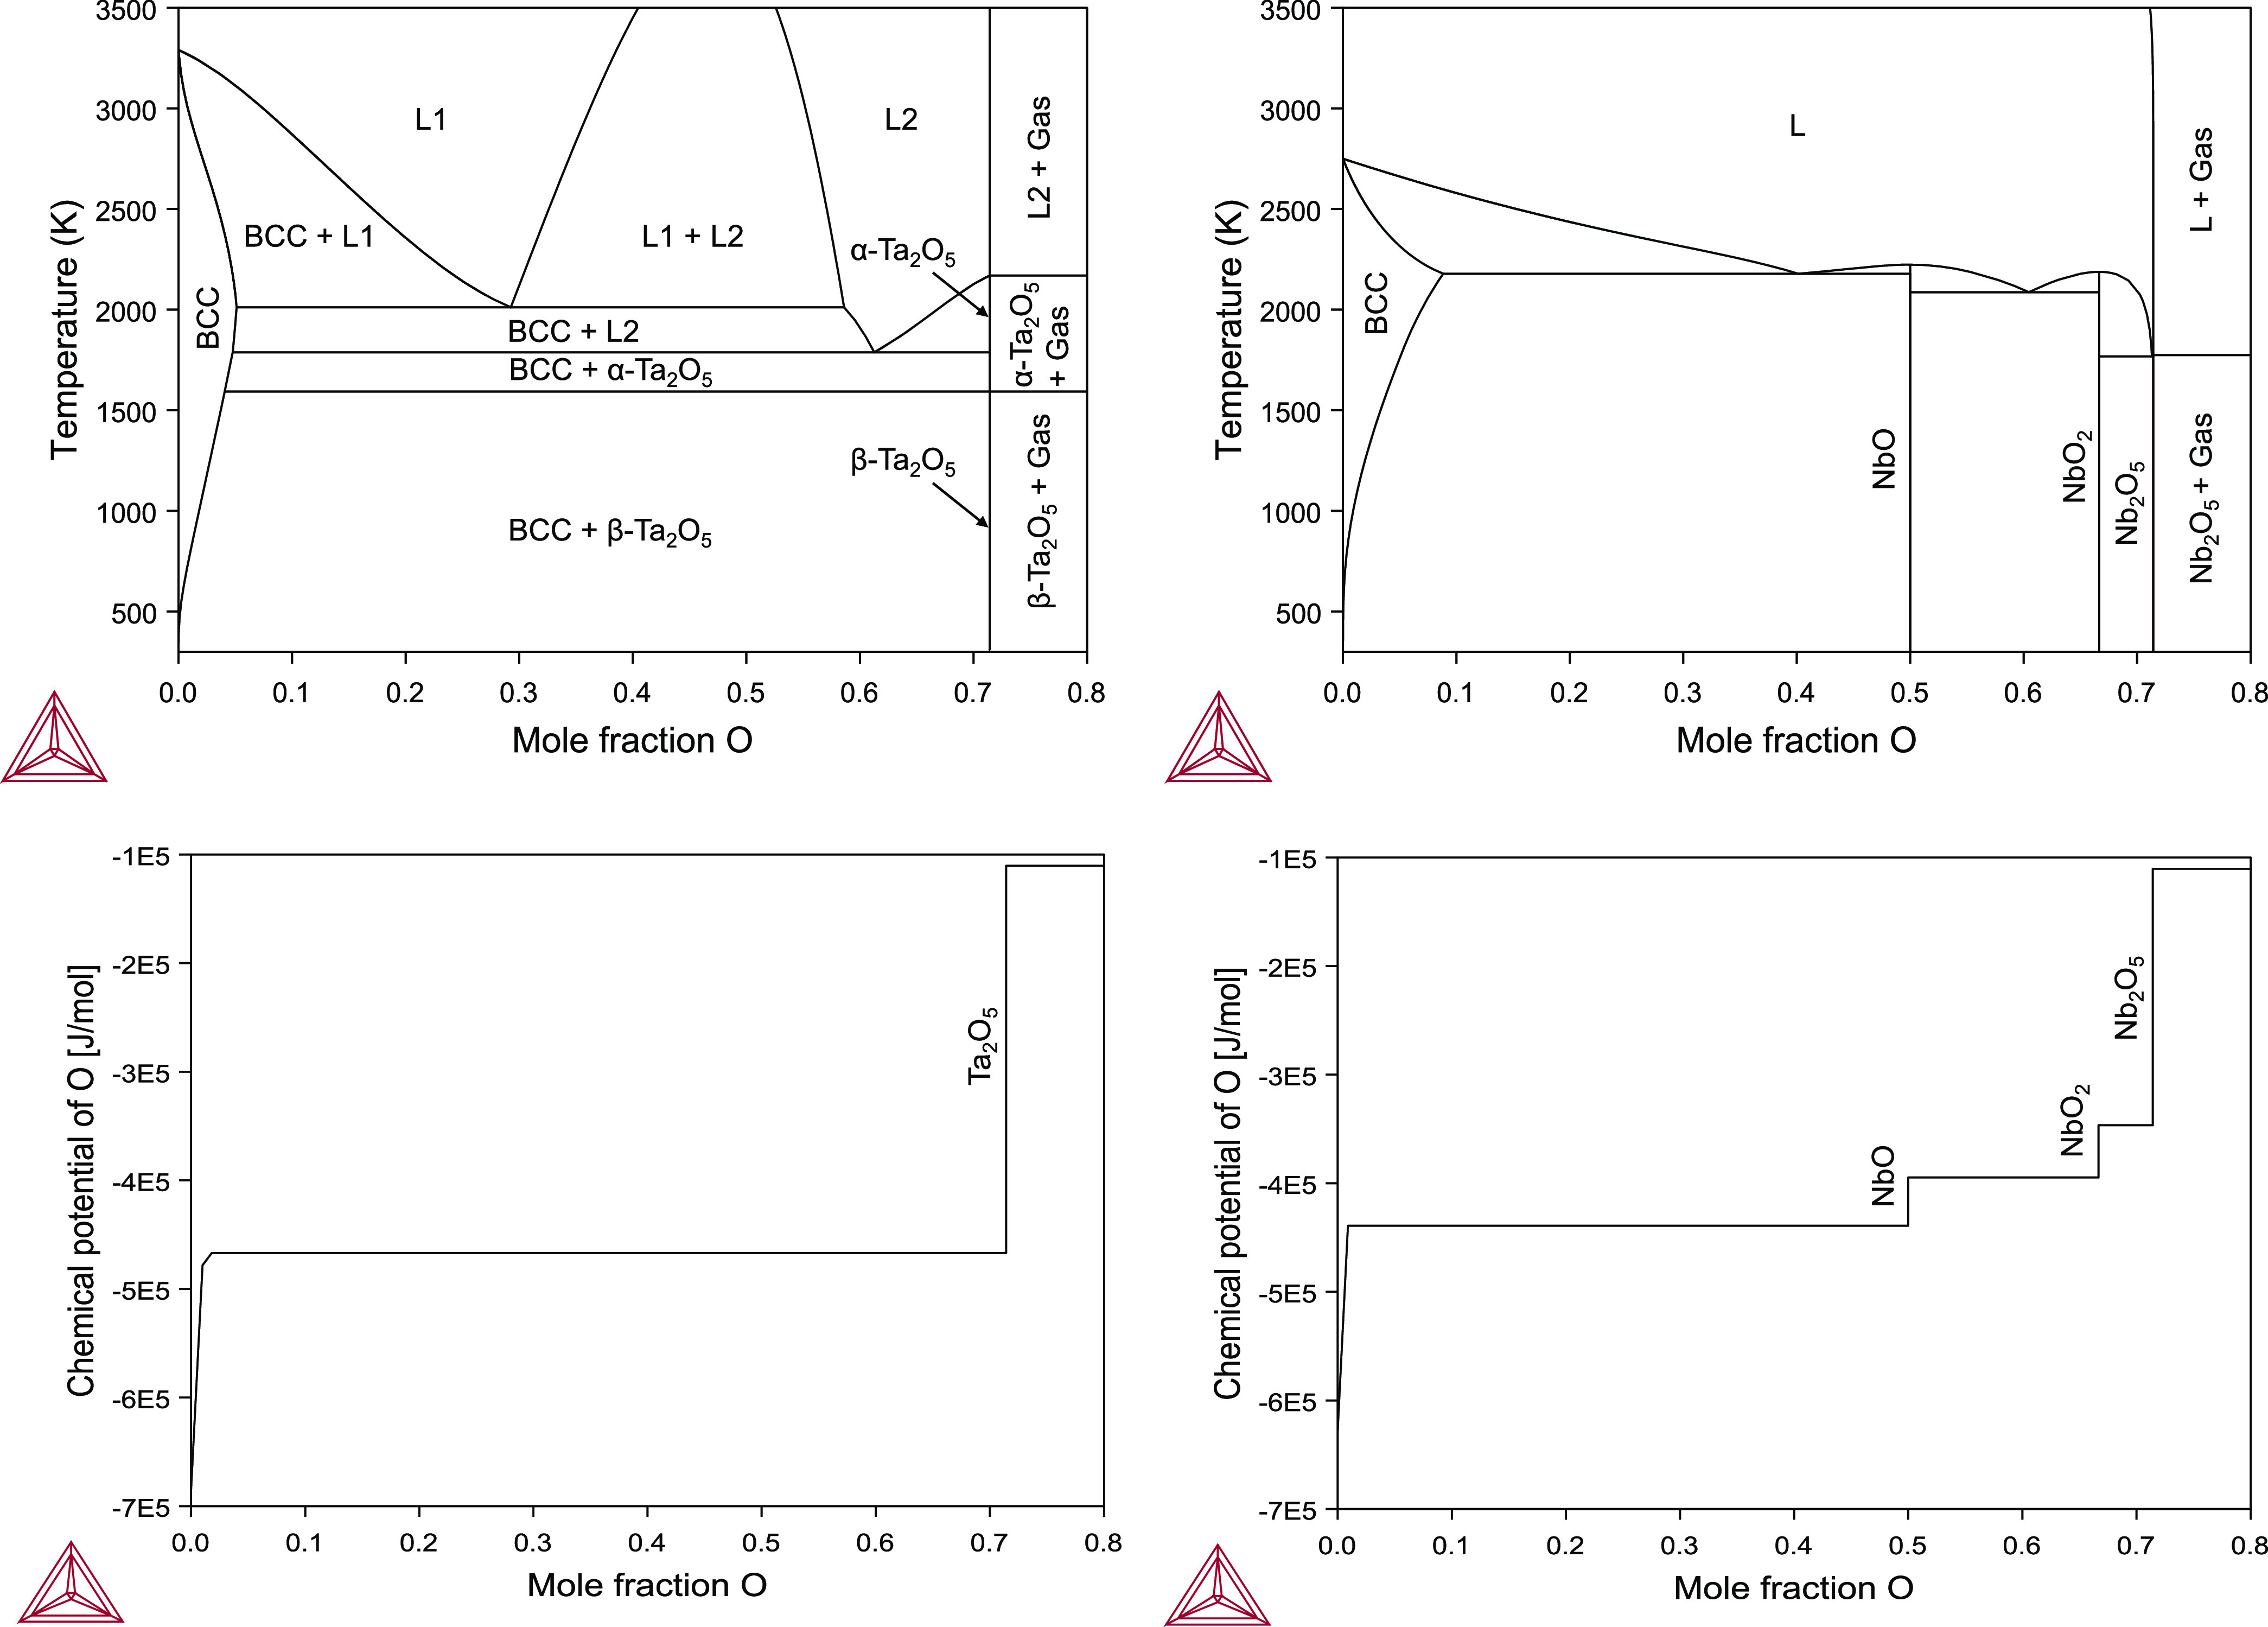
Calculated phase diagrams of the Ta–O and Nb–O systems and their respective oxygen chemical potentials as functions of oxygen mole fraction.

Calculated phase diagrams of the Ta–O and Nb–O systems and their respective oxygen chemical potentials as functions of oxygen mole fraction.