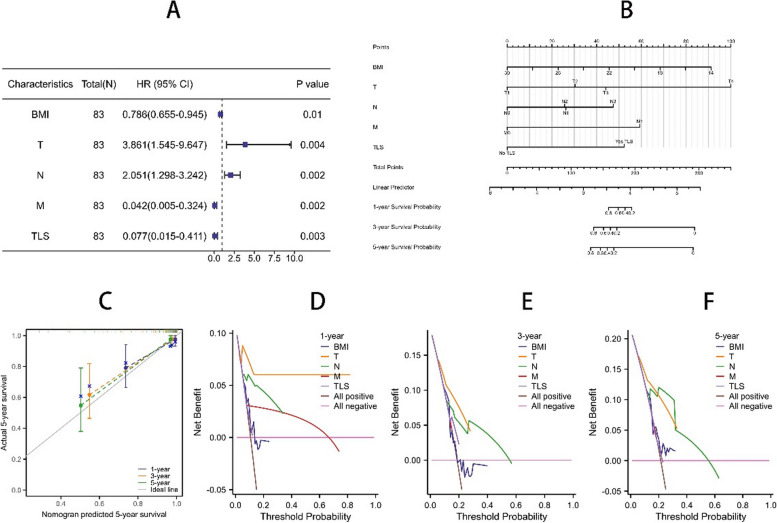
Fig. 3.
A is the multivariate results of BMI, T, N, M, TLS in the form of forest plots, B is the prediction nomogram of BMI, T, N, M, TLS, C is the 1-year calibration curves of BMI, T, N, M, TLS, D is the 1-year decision curve of BMI, T, N, M, TLS, E is the 3-year decision curve of BMI, T, N, M, TLS, and F is the 5-year decision curve of BMI, T, N, M, TLS

