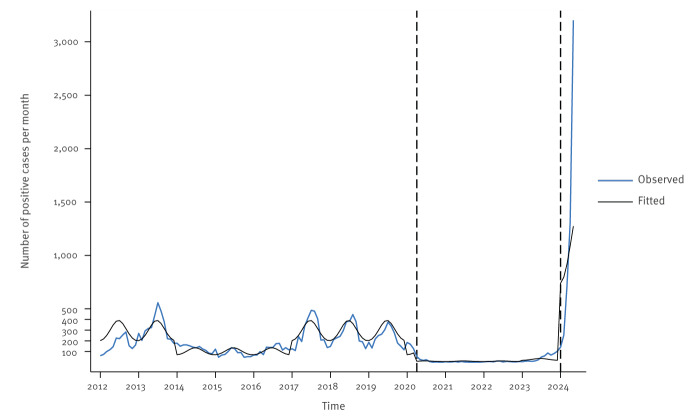
Figure 1.
Time series analysis of positive qPCR tests targeting IS481, France, 2012–2024
The black line reflects the values predicted by the negative binomial regression model. On the x-axis, the year marks correspond to the beginning of the year (January). Note that the data for 2012 were provided by only one of the two laboratories. The first vertical dashed line indicates the beginning of the first COVID-19 lockdown (1 April 2020). The second vertical dashed line corresponds to the start of the current outbreak and subsequent national alert (1 January 2024).

