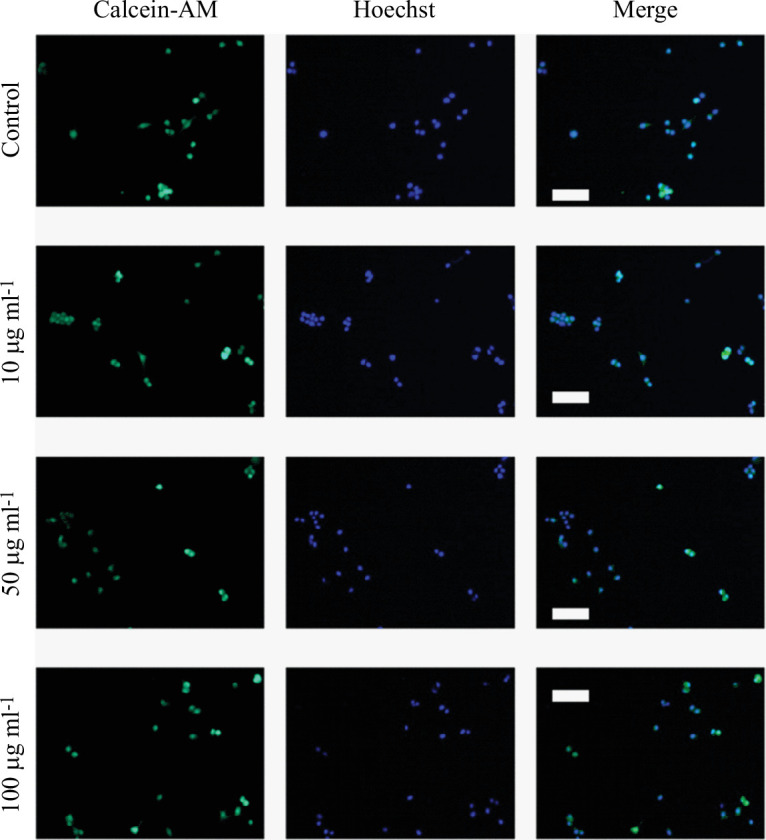
Figure 6.

Representative fluorescence confocal images of the effect of treatment with MNPs on cell viability. Neuro-2a cells were exposed to MNPs (1, 50 or 100 µg ml−1) or maintained under control conditions for 24 h. For each experimental condition, representative images are shown presenting Calcein-AM staining (first column), Hoechst 33 342 staining (second column) and merge (third column). Scale bars represent 100 μm.
