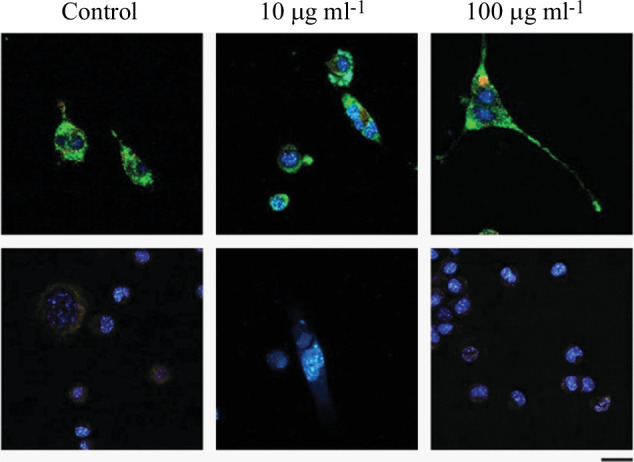
Figure 8.

Representative fluorescence confocal images of the intracellular effect of MNP exposure. Neuro-2a cells were exposed to MNPs (10 or 100 µg ml−1) or maintained under control conditions, and the effect of the exposure on some intracellular organelles was measured. Columns show different experimental conditions, while rows show the type of staining performed: the first row shows MitoTracker in green, LysoTracker in red and Hoechst 33 342 in blue. The second row shows MitoSOX in red and Hoechst 33 342 staining in blue. Scale bar is 25 µm.
