FIGURE 1.

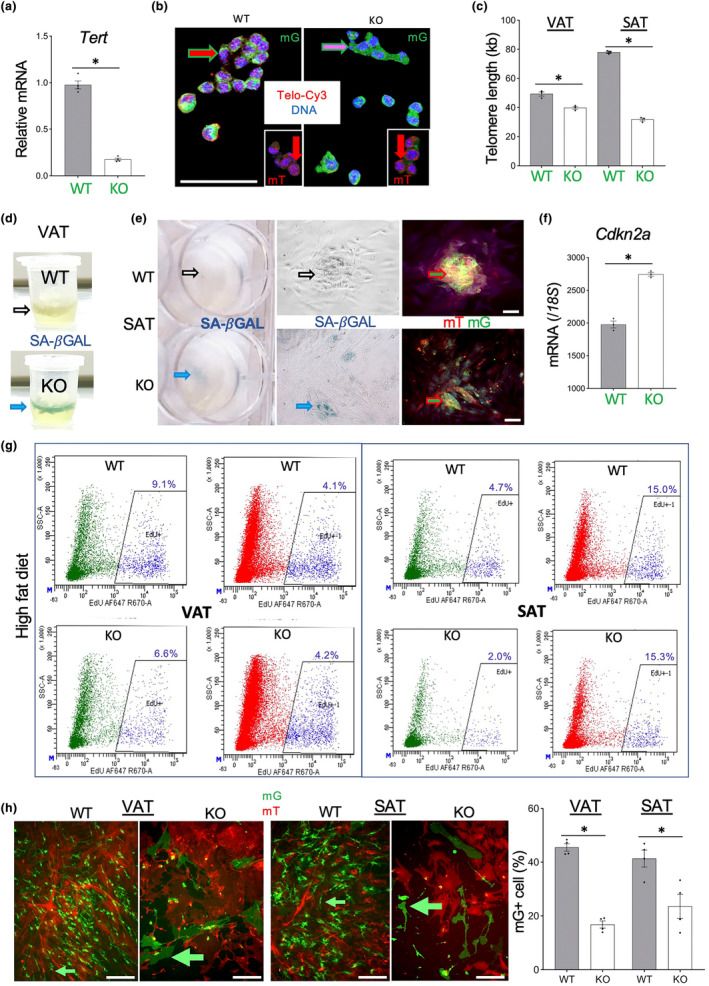
Endothelial cells (EC) Tert KO results in AT EC telomere attrition and senescence. (a) q‐RT‐PCR reveals Tert expression reduction in mG+ cells FACS‐sorted from SAT of EC‐Tert‐KO mice (8 months old). (b) Telo‐FISH reveals shorter telomeres (lower red TelC‐Cy3 signal) in mG+ cells (green outline arrow) from VAT of EC‐Tert‐KO mice (12 months old), whereas nuclear TelC‐Cy3 signal in mT+ cells (insets) is comparable. (c) q‐PCR on DNA from VAT and SAT mG+ lineage cells reveals shorter telomeres in HFD‐fed EC‐Tert‐KO mice at 8 months of age. Real‐time PCR data are normalized to data for a single copy gene. (d) SA‐β‐gal staining reveals senescence in VAT of EC‐Tert‐KO mice (8 months old). (e) SA‐β‐gal staining reveals senescence in cultured mG+ cells from SAT of EC‐Tert‐KO mice (8‐month‐old). Left: plate wells; middle: brightfield micrograph; right: fluorescence of the same area. EC colonies (mG+) are intermixed with stromal cells (mT+), which results in yellow color. (f) q‐RT‐PCR reveals higher Cdkn2a expression (normalized to 18S RNA) in mG+ cells FACS‐sorted from SAT of EC‐Tert‐KO mice (8 months old). (g) Flow cytometry on SVF recovered 3 days after EdU injection comparing incorporation into mG+ and mT+ cells in VAT, and SAT of HFD‐fed mice at 9 months of age. EdU fluorescence: 647 nm channel, side scatter is used for separation. (h) Primary culture of SVC from VAT and SAT of 7‐month‐old mice 2 days after plating at identical density. Note reduced proliferation and the large size of mG+ cells from EC‐Tert‐KO mice. For all data, shown are mean ± SEM (error bars). *p < 0.05 (two‐sided Student's t‐test). Scale bar = 100 μm.
