FIGURE 6.

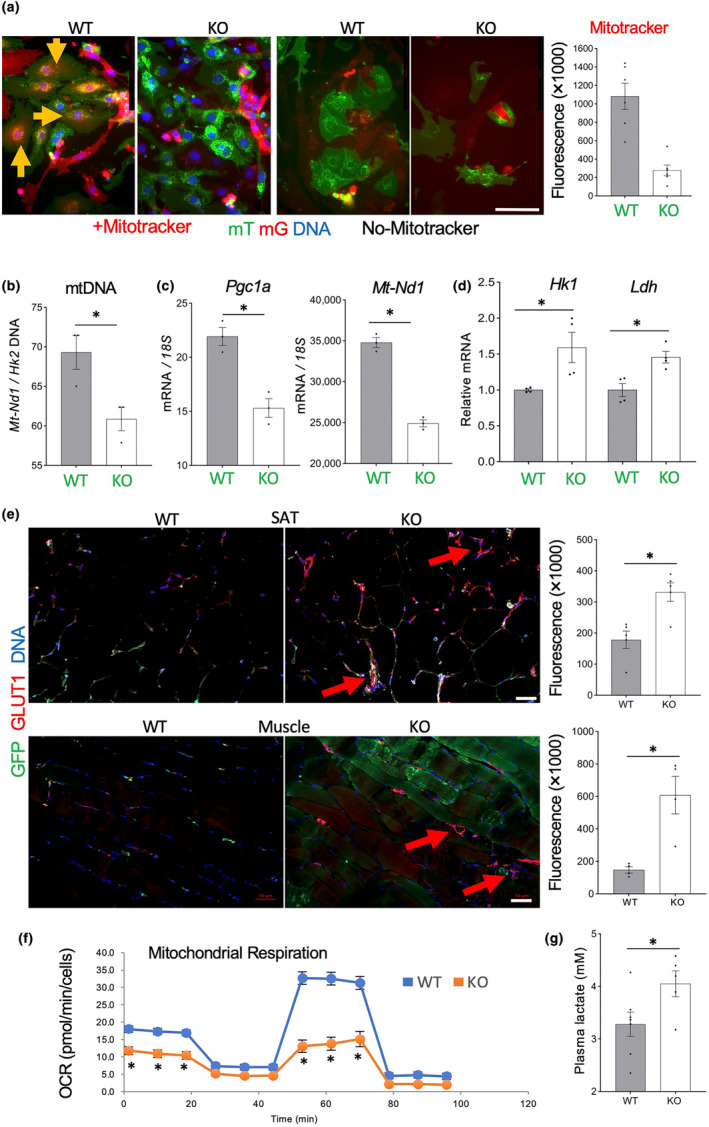
Tert‐KO endothelial cells (EC) have reduced mitochondrial function and increased glycolysis. (a) Primary culture of mixed mT/mG SVC from SAT of 12‐month‐old mice 2 days after plating at identical density stained with Mitotracker (red). Note that intracellular Mitotracker signal (arrow) is reduced in mG+ Tert‐KO EC. Graph: data quantification. (b) Mitochondrial DNA content, based on the ratio of ND1 to HK2 gene expression measured by q‐RT‐PCR in mG+ cells FACS‐sorted from SAT of EC‐Tert‐KO mice (8 months old). (c) q‐RT‐PCR reveals lower expression of mitochondrial respiration genes PGC1a (normalized to 18S RNA). (d) q‐RT‐PCR reveals higher expression of glycolysis effectors HK1 (p = 0.03) and LDH (p = 0.009) (normalized to 18S RNA). (e) IF analysis of GLUT1 expression showing its induction colocalized with mG+ blood vessels in SAT and skeletal muscle sections of EC‐Tert‐KO mice. Graphs: data quantification. (f) Seahorse XF Cell Mito Stress Assay revealing decreased basal and induced oxygen consumption rate (OCR). (g) Increased lactate concentration in plasma of EC‐Tert‐KO mice. For all data, shown are mean ± SEM (error bars). *p < 0.05 (two‐sided Student's t‐test). Scale bar = 50 μm.
