
FIGURE 1.
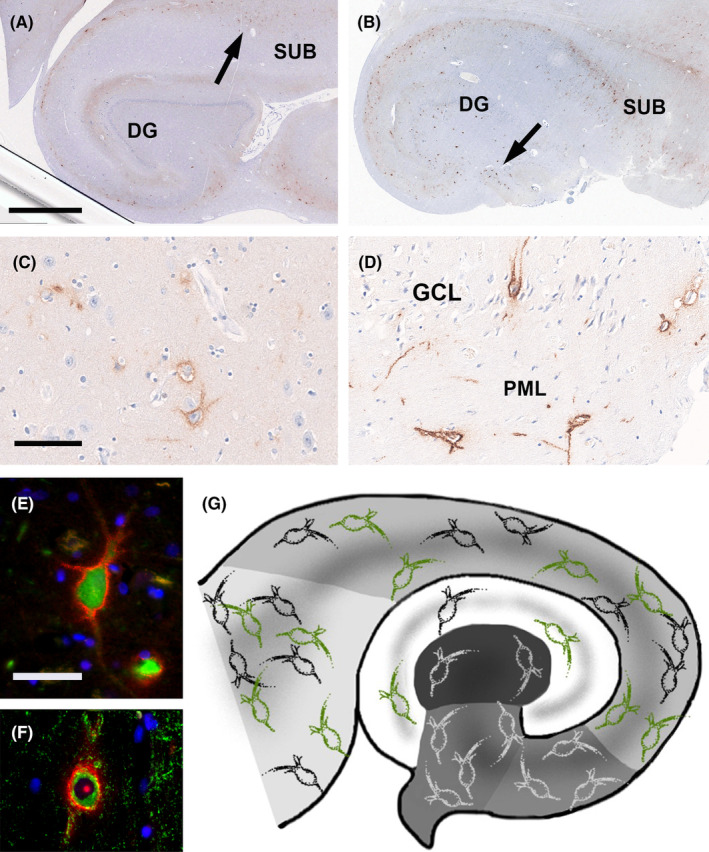
PNN in surgical adult human hippocampus as visualized by anti‐aggrecan immunohistochemistry. (A) This 56‐year‐old control patient had a distribution pattern of PNN in the subiculum (SUB, arrow) and Dentate Gyrus (DG) representative for our post‐mortem controls. (B) This 53‐year‐old patient had epilepsy and HS ILAE type 3. (C) Higher magnification of PNN in the subiculum of the patient shown in A. (D) Higher magnification of PNN in the Dentate Gyrus granule cell layer (GCL) and polymorphic cell layer (PML) of the patient shown in B (see arrow therein). (E) Double immunofluorescence image showing a Parvalbumin‐immunoreactive neuron in green, covered by an aggrecan‐immunoreactive PNN in red fluorescent dye. DAPI staining for cell nuclei in blue. (F) Double immunofluorescence image showing a GAD‐immunoreactive neuron in green, covered by an aggrecan‐immunoreactive PNN in red. DAPI staining for cell nuclei in blue. (G) Green PNN represented regions with PNN increase in the epileptic condition (not at scale, see Figure 3 for actual densities) compared to the normal distribution colored in black and white. Anatomical regions of the hippocampus were color coded with the subiculum on the left in light gray and the CA4 region in the center in dark gray. The Dentate Gyrus is shown in white. Scale bar in A = 2.5 mm, applies also to (B). Scale bar in C = 100 μm, applies also to (D). Scale bar in E = 50 μm, applies also to (F).