
FIGURE 3.
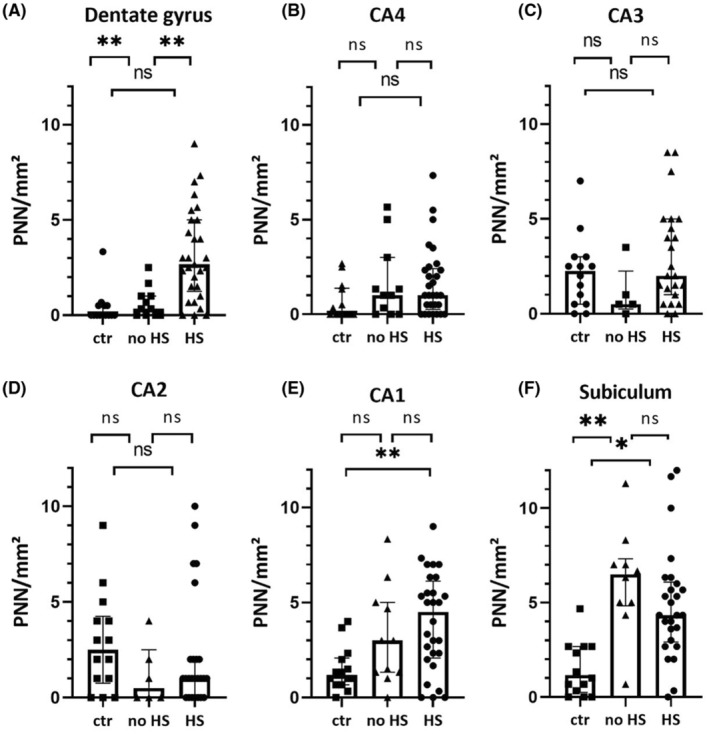
Subregional analysis of PNN. There was a significant group difference in the PNN density comparing HS with controls in DG, CA1 and the Subiculum. In the Dentate Gyrus, there also was a significant difference between HS and no HS, and in the subiculum between no HS and controls. ctr, control; HS, Hippocampal Sclerosis; PNN, Perineuronal net. *p < 0.05; **p < 0.01 Data represented as medians with interquartile range.