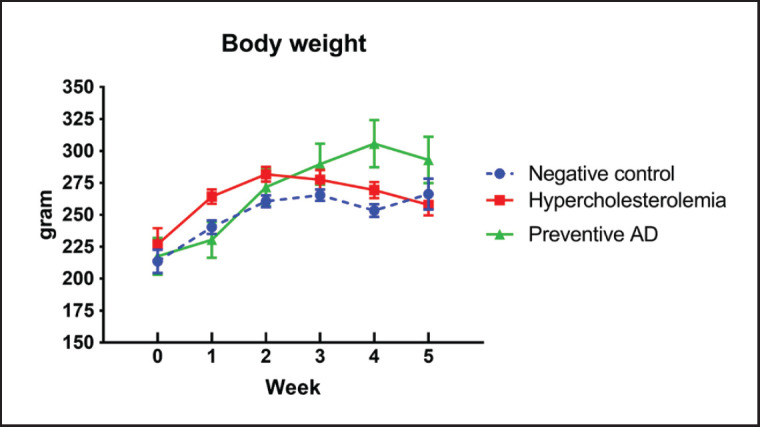
Figure 2. Average BW of rats in each treatment group throughout the 5 weeks study period. No significant differences exist in the BW at baseline (week-0). The BW of the hypercholesterolemia group (B) significantly increased in weeks 1 and 2 and then decreased. The BW of the preventive AD group significantly increased at weeks 4 and 5 compared to that of the control group. AD = Ampiang-Dadih.

